January 7, 2017

Hubble Provides Interstellar Road Map for Voyagers’ Galactic Trek

voyagers solar system
In this artist's conception, NASA's Voyager 1 spacecraft has a bird's-eye view of the solar system. The circles represent the orbits of the major outer planets: Jupiter, Saturn, Uranus, and Neptune. Launched in 1977, Voyager 1 visited the planets Jupiter and Saturn. The spacecraft is now 13 billion miles from Earth, making it the farthest and fastest-moving human-made object ever built. In fact, Voyager 1 is now zooming through interstellar space, the region between the stars that is filled with gas, dust, and material recycled from dying stars.

NASA’s two Voyager spacecraft are hurtling through unexplored territory on their road trip beyond our solar system. Along the way, they are measuring the interstellar medium, the mysterious environment between stars. NASA’s Hubble Space Telescope is providing the road map – by measuring the material along the probes’ future trajectories. Even after the Voyagers run out of electrical power and are unable to send back new data, which may happen in about a decade, astronomers can use Hubble observations to characterize the environment of through which these silent ambassadors will glide.

A preliminary analysis of the Hubble observations reveals a rich, complex interstellar ecology, containing multiple clouds of hydrogen laced with other elements. Hubble data, combined with the Voyagers, have also provided new insights into how our Sun travels through interstellar space.

voyagers solar system
In this illustration oriented along the ecliptic plane, NASA's Hubble Space Telescope looks along the paths of NASA's Voyager 1 and 2 spacecraft as they journey through the solar system and into interstellar space. Hubble is gazing at two sight lines (the twin cone-shaped features) along each spacecraft's path. The telescope's goal is to help astronomers map interstellar structure along each spacecraft's star-bound route. Each sight line stretches several light-years to nearby stars.

“This is a great opportunity to compare data from in situ measurements of the space environment by the Voyager spacecraft and telescopic measurements by Hubble,” said study leader Seth Redfield of Wesleyan University in Middletown, Connecticut. “The Voyagers are sampling tiny regions as they plow through space at roughly 38,000 miles per hour. But we have no idea if these small areas are typical or rare. The Hubble observations give us a broader view because the telescope is looking along a longer and wider path. So Hubble gives context to what each Voyager is passing through.”

The astronomers hope that the Hubble observations will help them characterize the physical properties of the local interstellar medium. “Ideally, synthesizing these insights with in situ measurements from Voyager would provide an unprecedented overview of the local interstellar environment,” said Hubble team member Julia Zachary of Wesleyan University.

NASA launched the twin Voyager 1 and 2 spacecraft in 1977. Both explored the outer planets Jupiter and Saturn. Voyager 2 went on to visit Uranus and Neptune.

The pioneering Voyager spacecraft are currently exploring the outermost edge of the Sun’s domain . Voyager 1 is now zooming through interstellar space, the region between the stars that is filled with gas, dust, and material recycled from dying stars.

Voyager 1 is 13 billion miles from Earth, making it the farthest human-made object ever built. In about 40,000 years, after the spacecraft will no longer be operational and will not be able to gather new data, it will pass within 1.6 light-years of the star Gliese 445, in the constellation Camelopardalis. Its twin, Voyager 2, is 10.5 billion miles from Earth, and will pass 1.7 light-years from the star Ross 248 in about 40,000 years.

For the next 10 years, the Voyagers will be making measurements of interstellar material, magnetic fields and cosmic rays along their trajectories. Hubble complements the Voyagers’ observations by gazing at two sight lines along each spacecraft’s path to map interstellar structure along their star-bound routes. Each sight line stretched several light-years to nearby stars. Sampling the light from those stars, Hubble’s Space Telescope Imaging Spectrograph measures how interstellar material absorbs some of the starlight, leaving telltale spectral fingerprints.

Hubble found that Voyager 2 will move out of the interstellar cloud that surrounds the solar system in a couple thousand years. The astronomers, based on Hubble data, predict that the spacecraft will spend 90,000 years in a second cloud and pass into a third interstellar cloud.

An inventory of the clouds’ composition reveals slight variations in the abundances of the chemical elements contained in the structures. “These variations could mean the clouds formed in different ways, or from different areas, and then came together,” Redfield said.

An initial look at the Hubble data also suggests that the Sun is passing through clumpier material in nearby space, which may affect the heliosphere, the large bubble containing our solar system that is produced by our Sun’s powerful solar wind. At its boundary, called the heliopause, the solar wind pushes outward against the interstellar medium. Hubble and Voyager 1 made measurements of the interstellar environment beyond this boundary, where the wind comes from stars other than our Sun.

“I’m really intrigued by the interaction between stars and the interstellar environment,” Redfield said. “These kinds of interactions are happening around most stars, and it is a dynamic process.”

The heliosphere is compressed when the Sun moves through dense material, but it expands back out when the star passes through low-density matter. This expansion and contraction is caused by the interaction between the outward pressure of the stellar wind, composed of a stream of charged particles, and the pressure of the interstellar material surrounding a star.

Image Credit: X-ray: NASA, ESA, G. Bacon (STScI). Z. Levay (STScI)
Explanation from: https://www.nasa.gov/feature/goddard/2017/hubble-provides-interstellar-road-map-for-voyagers-galactic-trek

Hubble Detects ‘Exocomets’ Taking the Plunge Into a Young Star

Hubble Detects ‘Exocomets’ Taking the Plunge Into a Young Star
This illustration shows several comets speeding across a vast protoplanetary disk of gas and dust and heading straight for the youthful, central star. These "kamikaze" comets will eventually plunge into the star and vaporize. The comets are too small to photograph, but their gaseous spectral "fingerprints" on the star's light were detected by NASA's Hubble Space Telescope. The gravitational influence of a suspected Jupiter-sized planet in the foreground may have catapulted the comets into the star. This star, called HD 172555, represents the third extrasolar system where astronomers have detected doomed, wayward comets. The star resides 95 light-years from Earth.

Interstellar forecast for a nearby star: Raining comets! NASA’s Hubble Space Telescope has discovered comets plunging onto the star HD 172555, which is a youthful 23 million years old and resides 95 light-years from Earth.

The exocomets — comets outside our solar system — were not directly seen around the star, but their presence was inferred by detecting gas that is likely the vaporized remnants of their icy nuclei.

HD 172555 represents the third extrasolar system where astronomers have detected doomed, wayward comets. All of the systems are young, under 40 million years old.

The presence of these doomed comets provides circumstantial evidence for “gravitational stirring” by an unseen Jupiter-size planet, where comets deflected by its gravity are catapulted into the star. These events also provide new insights into the past and present activity of comets in our solar system. It’s a mechanism where infalling comets could have transported water to Earth and the other inner planets of our solar system.

Astronomers have found similar plunges in our own solar system. Sun-grazing comets routinely fall into our sun. “Seeing these sun-grazing comets in our solar system and in three extrasolar systems means that this activity may be common in young star systems,” said study leader Carol Grady of Eureka Scientific Inc. in Oakland, California, and NASA's Goddard Spaceflight Center in Greenbelt, Maryland. “This activity at its peak represents a star’s active teenage years. Watching these events gives us insight into what probably went on in the early days of our solar system, when comets were pelting the inner solar system bodies, including Earth. In fact, these star-grazing comets may make life possible, because they carry water and other life-forming elements, such as carbon, to terrestrial planets.”

The star is part of the Beta Pictoris Moving Group, a collection of stars born from the same stellar nursery. It is the second group member found to harbor such comets. Beta Pictoris, the group’s namesake, also is feasting on exocomets travelling too close. A young gas-giant planet has been observed in that star’s vast debris disk.

The stellar group is important to study because it is the closest collection of young stars to Earth. At least 37.5 percent of the more massive stars in the Beta Pictoris Moving Group either have a directly imaged planet, such as 51 Eridani b in the 51 Eridani system, or infalling star-grazing bodies, or, in the case of Beta Pictoris, both types of objects. The grouping is at about the age that it should be building terrestrial planets, Grady said.

A team of French astronomers first discovered exocomets transiting HD 172555 in archival data gathered between 2004 and 2011 by the European Southern Observatory’s HARPS (High Accuracy Radial velocity Planet Searcher) planet-finding spectrograph. A spectrograph divides light into its component colors, allowing astronomers to detect an object’s chemical makeup. The HARPS spectrograph detected the chemical fingerprints of calcium imprinted in the starlight, evidence that comet-like objects were falling into the star.

As a follow-up to that discovery, Grady’s team used Hubble’s Space Telescope Imaging Spectrograph (STIS) and the Cosmic Origins Spectrograph (COS) in 2015 to conduct a spectrographic analysis in ultraviolet light, which allows Hubble to identify the signature of certain elements. Hubble made two observations, separated by six days.

Hubble detected silicon and carbon gas in the starlight. The gas was moving at about 360,000 miles per hour across the face of the star. The most likely explanation for the speedy gas is that Hubble is seeing material from comet-like objects that broke apart after streaking across the face of the star.

The gaseous debris from the disintegrating comets is vastly dispersed in front of the star. “As transiting features go, this vaporized material is easy to see because it contains very large structures,” Grady said. “This is in marked contrast to trying to find a small transiting exoplanet, where you’re looking for tiny dips in the star’s light.”

Hubble gleaned this information because the HD 172555 debris disk surrounding the star is slightly inclined to Hubble’s line of sight, giving the telescope a clear view of comet activity.

Grady’s team hopes to use STIS again in follow-up observations to look for oxygen and hydrogen, which would confirm the identity of the disintegrating objects as comets.

“Hubble shows that these star-grazers look and move like comets, but until we determine their composition, we cannot confirm they are comets,” Grady said. “We need additional data to establish whether our star-grazers are icy like comets or more rocky like asteroids.”

Image Credit: NASA, ESA, A. Feild and G. Bacon (STScI)
Explanation from: https://www.nasa.gov/feature/goddard/2017/hubble-detects-exocomets-taking-the-plunge-into-a-young-star

Earth and the International Space Station

Earth and the International Space Station

The International Space Station seen from Space Shuttle Discovery as the two spacecraft undocked. Earlier the STS-128 and Expedition 20 crew concluded nine days of work on the Shuttle and Station. Undocking of the two spacecraft occurred at 21:26 CEST on 8 September 2009.

Image Credit: NASA

Earth and Moon seen by Mars Reconnaissance Orbiter from 205 million kilometers away

Earth and Moon seen by Mars Reconnaissance Orbiter spacecraft from 205 million kilometers away

From the most powerful telescope orbiting Mars comes a new view of Earth and its moon, showing continent-size detail on the planet and the relative size of the Moon.

The image combines two separate exposures taken on Nov. 20, 2016, by the High Resolution Imaging Science Experiment (HiRISE) camera on NASA's Mars Reconnaissance Orbiter. The images were taken to calibrate HiRISE data, since the reflectance of the Moon's Earth-facing side is well known. For presentation, the exposures were processed separately to optimize detail visible on both Earth and the Moon. The Moon is much darker than Earth and would barely be visible if shown at the same brightness scale as Earth.

The combined view retains the correct positions and sizes of the two bodies relative to each other. The distance between Earth and the Moon is about 30 times the diameter of Earth. Earth and the Moon appear closer than they actually are in this image because the observation was planned for a time at which the Moon was almost directly behind Earth, from Mars' point of view, to see the Earth-facing side of the Moon.

In the image, the reddish feature near the middle of the face of Earth is Australia. When the component images were taken, Mars was about 127 million miles (205 million kilometers) from Earth.

Image Credit: X-ray: NASA/JPL-Caltech/Univ. of Arizona
Explanation from: https://www.nasa.gov/feature/jpl/earth-and-its-moon-as-seen-from-mars

January 6, 2017

Colliding Galaxy Clusters & Eruption from a Supermassive Black Hole

Colliding Galaxy Clusters & Eruption from a Supermassive Black Hole


  • For the first time, two of the most powerful phenomena in the Universe have been clearly linked together in the same system.
  • An eruption from a supermassive black hole has been swept up into the collision between the galaxy clusters Abell 3411 and Abell 3412.
  • The result is an extraordinary acceleration of particles that explains mysterious swirling structures seen in radio data.
  • X-rays from Chandra were combined with several other telescopes to make this discovery.

Using data from NASA's Chandra X-ray Observatory and several other telescopes, astronomers have discovered a cosmic one-two punch unlike any ever seen in a pair of colliding galaxy clusters called Abell 3411 and Abell 3412. This result shows that an eruption from a supermassive black hole combined with a galaxy cluster merger can create a stupendous cosmic particle accelerator.

This composite image contains X-rays from Chandra (blue) that reveals diffuse emission from multi-million-degree gas in the two clusters. The comet-shaped appearance of the hot gas provides clear evidence that the two clusters are colliding and merging. The "head" of the comet is hot gas from one cluster plowing through the hot gas of the other cluster, in the direction shown by the arrow in the labeled image.

Radio emission detected by the Giant Metrewave Radio Telescope in India (red) represents colossal shock waves — cosmic versions of sonic booms generated by supersonic aircraft — produced by the collision of the hot gas associated with the galaxy clusters. Optical data from the Subaru telescope atop Mauna Kea, Hawaii, shows galaxies and stars with a range of different colors.

This new image also shows three different supermassive black holes in galaxies located in the merging clusters. The upper one shows that a jet powered by a supermassive black hole is connected to large swirls of radio emission. The team of astronomers thinks this connection provides important information about how the radio emission was produced.

This spinning, supermassive black hole is producing a rotating, tightly-wound magnetic funnel. The powerful electromagnetic fields associated with this structure have accelerated some of the inflowing gas away from the vicinity of the black hole in the form of an energetic, high-speed jet. Then, these accelerated particles in the jet were accelerated again when they encountered the shock waves from the galaxy cluster collision.

Jets from the two other supermassive black holes are likely having the same effect of accelerating particles before they get a second boost from the shock waves. The jets from one of the black holes are too short to be seen in the labeled image.

Image Credit: X-ray: NASA/CXC/SAO/R. van Weeren et al; Optical: NAOJ/Subaru; Radio: NCRA/TIFR/GMRT
Explanation from: http://chandra.harvard.edu/photo/2017/a3411/

Deepest X-ray Image Ever Reveals Black Hole Treasure Trove

Deepest X-ray Image Ever Reveals Black Hole Treasure Trove

  • This image contains the highest concentration of black holes ever seen, equivalent to 5,000 over the area of the full Moon.
  • Made with over 7 million seconds of Chandra observing time, this is the deepest X-ray image ever obtained.
  • These data give astronomers the best look yet at the growth of black holes over billions of years soon after the Big Bang.

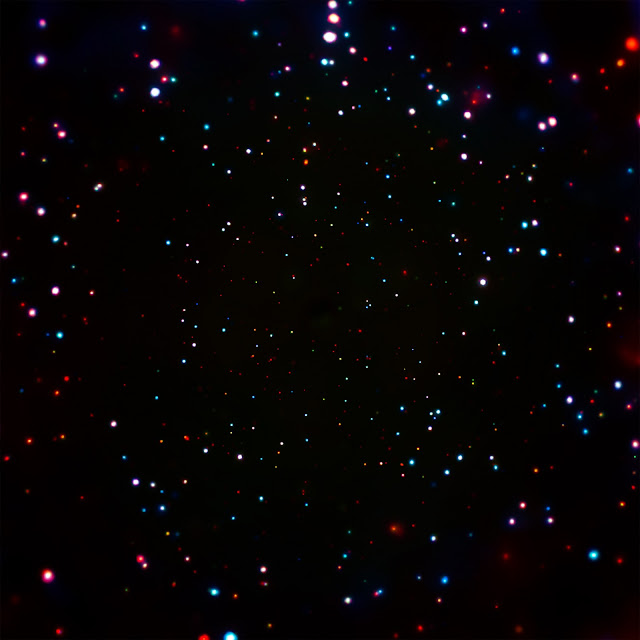
This is the deepest X-ray image ever obtained, made with over 7 million seconds of observing time with NASA's Chandra X-ray Observatory. These data give astronomers the best look yet at the growth of black holes over billions of years beginning soon after the Big Bang.

The image is from the Chandra Deep Field-South, or CDF-S. The full CDF-S field covers an approximately circular region on the sky with an area about two-thirds that of the full Moon. However, the outer regions of the image, where the sensitivity to X-ray emission is lower, are not shown here. The colors in this image represent different levels of X-ray energy detected by Chandra. Here the lowest-energy X-rays are red, the medium band is green, and the highest-energy X-rays observed by Chandra are blue.

The central region of this image contains the highest concentration of supermassive black holes ever seen, equivalent to about 5,000 objects that would fit into the area of the full Moon and about a billion over the entire sky.

Researchers used the CDF-S data in combination with data from the Cosmic Assembly Near-Infrared Deep Extragalactic Legacy Survey (CANDELS) and the Great Observatories Origins Deep Survey (GOODS), both including data from NASA's Hubble Space Telescope to study galaxies and black holes between one and two billion years after the Big Bang.

In one part of the study, the team looked at the X-ray emission from galaxies detected in the Hubble images, at distances between 11.9 and 12.9 billion light years from Earth. About 50 of these distant galaxies were individually detected with Chandra. The team then used a technique called X-ray stacking to investigate X-ray emission from the 2,076 distant galaxies that were not individually detected. They added up all the X-ray counts near the positions of these galaxies, enabling much greater sensitivity to be obtained. Through stacking the team were able to achieve equivalent exposure times up to about 8 billion seconds, equivalent to about 260 years.

Using these data, the team found evidence that black holes in the early Universe grow mostly in bursts, rather than via the slow accumulation of matter. The team may have also found hints about the types of seeds that form supermassive black holes. If supermassive black holes are born as "light" seeds weighing about 100 times the Sun's mass, the growth rate required to reach a mass of about a billion times the Sun in the early Universe may be so high that it challenges current models for such growth. If supermassive black holes are born with more mass, the required growth rate is not as high. The data in the CDF-S suggest that the seeds for supermassive black holes may be "heavy" with masses about 10,000 to 100,000 times that of the Sun.

Such deep X-ray data like those in the CDF-S provide useful insights for understanding the physical properties of the first supermassive black holes. The relative number of luminous and faint objects — in what astronomers call the shape of the "luminosity function" — depends on the mixture of the several physical quantities involved in black hole growth, including the mass of the black hole seeds and the rate at which they are pulling in material. The CDF-S data show a rather "flat" luminosity function (i.e., a relative large number of bright objects) that can be used to infer possible combinations of these physical quantities. However, definitive results can only come from further observations.

Image Credit: X-ray: NASA/CXC/Penn State/B.Luo et al.
Explanation from: http://chandra.harvard.edu/photo/2017/cdfs/

The IRAS 16399-0937 Galaxy

The IRAS 16399-0937 Galaxy

This galaxy has a far more exciting and futuristic classification than most — it is a megamaser. Megamasers are intensely bright, around 100 million times brighter than the masers found in galaxies like the Milky Way. The entire galaxy essentially acts as an astronomical laser that beams out microwave emission rather than visible light (hence the ‘m’ replacing the ‘l’).

This megamaser is named IRAS 16399-0937, and is located over 370 million light-years from Earth. This NASA/ESA Hubble Space Telescope image belies the galaxy’s energetic nature, instead painting it as a beautiful and serene cosmic rosebud. The image comprises observations captured across various wavelengths by two of Hubble’s instruments: the Advanced Camera for Surveys (ACS), and the Near Infrared Camera and Multi-Object Spectrometer (NICMOS).

NICMOS’s superb sensitivity, resolution, and field of view gave astronomers the unique opportunity to observe the structure of IRAS 16399-0937 in detail. They found that IRAS 16399-0937 hosts a double nucleus — the galaxy’s core is thought to be formed of two separate cores in the process of merging. The two components, named IRAS 16399N and IRAS 16399S for the northern and southern parts respectively, sit over 11 000 light-years apart. However, they are both buried deep within the same swirl of cosmic gas and dust and are interacting, giving the galaxy its peculiar structure.

The nuclei are very different. IRAS 16399S appears to be a starburst region, where new stars are forming at an incredible rate. IRAS 16399N, however, is something known as a LINER nucleus (Low Ionization Nuclear Emission Region), which is a region whose emission mostly stems from weakly-ionised or neutral atoms of particular gases. The northern nucleus also hosts a black hole with some 100 million times the mass of the Sun!

Image Credit: ESA/Hubble & NASA, Judy Schmidt
Explanation from: https://www.spacetelescope.org/images/potw1652a/

Planets in the Making

Planets in the Making

Our Solar System formed out of a huge, primordial cloud of gas and dust. The vast majority of that cloud formed the Sun, while the leftover disc of rotating material around it eventually coalesced into the orbiting planets we know — and live on — today.

Astronomers can observe similar processes happening around other stars in the cosmos. This splendid picture shows a disc of rotating, leftover material surrounding the young star HD 163296. Using the observing power of the Atacama Large Millimeter/submillimeter Array (ALMA) in Chile, astronomers have been able to discern specific features in the disc, including concentric rings of material surrounding the central star. They were even able to use ALMA to obtain high-resolution measurements of the gas and dust constituents of the disc. With these data they could infer key details of the formation history of this young stellar system.

The three gaps between the rings are likely due to a depletion of dust and in the middle and outer gaps astronomers also found a lower level of gas. The depletion of both dust and gas suggests the presence of newly formed planets, each around the mass of Saturn, carving out these gaps on their brand new orbits.

Image Credit: ESO, ALMA (ESO/NAOJ/NRAO); A. Isella; B. Saxton (NRAO/AUI/NSF)
Explanation from:https://www.eso.org/public/images/potw1652a/

Colliding Galaxies IRAS 14348-1447

Colliding Galaxies IRAS 14348-1447

This delicate smudge in deep space is far more turbulent than it first appears. Known as IRAS 14348-1447 — a name derived in part from that of its discoverer, the Infrared Astronomical Satellite (IRAS for short) — this celestial object is actually a combination of two gas-rich spiral galaxies. This doomed duo approached one another too closely in the past, gravity causing them to affect and tug at each other and slowly, destructively, merge into one. The image was taken by Hubble’s Advanced Camera for Surveys (ACS).

IRAS 14348-1447 is located over a billion light-years away from us. It is one of the most gas-rich examples known of an ultraluminous infrared galaxy, a class of cosmic objects that shine characteristically — and incredibly — brightly in the infrared part of the spectrum. Almost 95% of the energy emitted by IRAS 14348-1447 is in the far-infrared!

The huge amount of molecular gas within IRAS 14348-1447 fuels its emission, and undergoes a number of dynamical processes as it interacts and moves around; these very same mechanisms are responsible for IRAS 14348-1447’s own whirling and ethereal appearance, creating prominent tails and wisps extending away from the main body of the galaxy.

Image Credit: ESA/Hubble & NASA
Explanation from: https://www.spacetelescope.org/images/potw1701a/