May 5, 2017

The Milky Way Galaxy

Milky Way Galaxy

For decades, astronomers have been blind to what our galaxy, the Milky Way, really looks like. After all, we sit in the midst of it and can't step outside for a bird's-eye view.

Now, new images from NASA's Spitzer Space Telescope are shedding light on the true structure of the Milky Way, revealing that it has just two major arms of stars instead of the four it was previously thought to possess.

"Spitzer has provided us with a starting point for rethinking the structure of the Milky Way," said Robert Benjamin of the University of Wisconsin, Whitewater. "We will keep revising our picture in the same way that early explorers sailing around the globe had to keep revising their maps."

Since the 1950s, astronomers have produced maps of the Milky Way. The early models were based on radio observations of gas in the galaxy, and suggested a spiral structure with four major star-forming arms, called Norma, Scutum-Centaurus, Sagittarius and Perseus. In addition to arms, there are bands of gas and dust in the central part of the galaxy. Our Sun lies near a small, partial arm called the Orion Arm, or Orion Spur, located between the Sagittarius and Perseus arms.

"For years, people created maps of the whole galaxy based on studying just one section of it, or using only one method," said Benjamin. "Unfortunately, when the models from various groups were compared, they didn't always agree. It's a bit like studying an elephant blind-folded."

Large infrared sky surveys in the 1990s led to some major revisions of these models, including the discovery of a large bar of stars in the middle of the Milky Way. Infrared light can penetrate through dust, so telescopes designed to pick up infrared light get better views of our dusty and crowded galactic center. In 2005, Benjamin and his colleagues used Spitzer's infrared detectors to obtain detailed information about our galaxy's bar, and found that it extends farther out from the center of the galaxy than previously thought.

The team of scientists now has new infrared imagery from Spitzer of an expansive swath of the Milky Way, stretching 130 degrees across the sky and one degree above and below the galaxy's mid-plane. This extensive mosaic combines 800,000 snapshots and includes over 110 million stars.

Benjamin developed software that counts the stars, measuring stellar densities. When he and his teammates counted stars in the direction of the Scutum-Centaurus Arm, they noticed an increase in their numbers, as would be expected for a spiral arm. But, when they looked in the direction where they expected to see the Sagittarius and Norma arms, there was no jump in the number of stars. The fourth arm, Perseus, wraps around the outer portion of our galaxy and cannot be seen in the new Spitzer images.

The findings make the case that the Milky Way has two major spiral arms, a common structure for galaxies with bars. These major arms, the Scutum-Centaurus and Perseus arms, have the greatest densities of both young, bright stars, and older, so-called red-giant stars. The two minor arms, Sagittarius and Norma, are filled with gas and pockets of young stars. Benjamin said the two major arms seem to connect up nicely with the near and far ends of the galaxy's central bar.

"Now, we can fit the arms together with the bar, like pieces of a puzzle," said Benjamin, "and, we can map the structure, position and width of these arms for the first time." Previous infrared observations found hints of a two-armed Milky Way, but those results were unclear because the position and width of the arms were unknown.

Though galaxy arms appear to be intact features, stars are actually constantly moving in and out of them as they orbit the center of the Milky Way, like London commuters in a busy traffic circle. Our own Sun might have once resided in a different arm. Since it was formed more than 4 billion years ago, it has traveled around the galaxy 16 times.

Image Credit: NASA/JPL-Caltech/R. Hurt (SSC/Caltech)
Explanation from: http://www.spitzer.caltech.edu/news/277-ssc2008-10-Two-of-the-Milky-Way-s-Spiral-Arms-Go-Missing

The Orion Nebula

Orion NebulaOrion Nebula

This image from NASA's Spitzer Space Telescope shows what lies near the sword of the constellation Orion -- an active stellar nursery containing thousands of young stars and developing protostars. Many will turn out like our Sun. Some are even more massive. These massive stars light up the Orion nebula, which is seen here as the bright region near the center of the image.

To the north of the Orion nebula is a dark filamentary cloud of cold dust and gas, over 5 light-years in length, containing ruby red protostars that jewel the hilt of Orion's sword. These are the newest generation of stars in this stellar nursery, and include the protostar HOPS 68, where Spitzer spotted tiny green crystals in a surrounding cloud of gas.

Image Credit: NASA/JPL-Caltech/T. Megeath (University of Toledo, Ohio)
Explanation from: http://www.spitzer.caltech.edu/images/3628-ssc2011-06a-Stars-Adorn-Orion-s-Sword

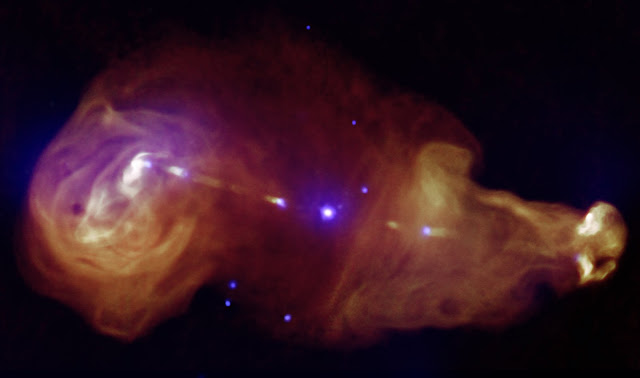
3C353: Giant Plumes of Radiation

3C353: Giant Plumes of Radiation

Jets generated by supermassive black holes at the centers of galaxies can transport huge amounts of energy across great distances. 3C353 is a wide, double-lobed source where the galaxy is the tiny point in the center and giant plumes of radiation can be seen in X-rays from Chandra (purple) and radio data from the Very Large Array (orange).

Image Credit: X-ray: NASA/CXC/Tokyo Institute of Technology/J.Kataoka et al, Radio: NRAO/VLA
Explanation from: http://chandra.harvard.edu/photo/2013/archives/

Galaxy Cluster Abell 370

Galaxy Cluster Abell 370

The NASA/ESA Hubble Telescope has peered across six billion light years of space to resolve extremely faint features of the galaxy cluster Abell 370 that have not been seen before. Imaged here in stunning detail, Abell 370 is part of the Frontier Fields programme which uses massive galaxy clusters to study the mysteries of dark matter and the very early Universe.

Six billion light-years away in the constellation Cetus (the Sea Monster), Abell 370 is made up of hundreds of galaxies. Already in the mid-1980s higher-resolution images of the cluster showed that the giant luminous arc in the lower left of the image was not a curious structure within the cluster, but rather an astrophysical phenomenon: the gravitationally lensed image of a galaxy twice as far away as the cluster itself. Hubble helped show that this arc is composed of two distorted images of an ordinary spiral galaxy that just happens to lie behind the cluster.

Abell 370’s enormous gravitational influence warps the shape of spacetime around it, causing the light of background galaxies to spread out along multiple paths and appear both distorted and magnified. The effect can be seen as a series of streaks and arcs curving around the centre of the image. Massive galaxy clusters can therefore act like natural telescopes, giving astronomers a close-up view of the very distant galaxies behind the cluster — a glimpse of the Universe in its infancy, only a few hundred million years after the Big Bang.

This image of Abell 370 was captured as part of the Frontier Fields programme, which used a whopping 630 hours of Hubble observing time, over 560 orbits of the Earth. Six clusters of galaxies were imaged in exquisite detail, including Abell 370 which was the very last one to be finished. An earlier image of this object — using less observation time and therefore not recording such faint detail — was published in 2009.

During the cluster observations, Hubble also looked at six “parallel fields”, regions near the galaxy clusters which were imaged with the same exposure times as the clusters themselves. Each cluster and parallel field were imaged in infrared light by the Wide Field Camera 3 (WFC3), and in visible light by the Advanced Camera for Surveys (ACS).

The Frontier Fields programme produced the deepest observations ever made of galaxy clusters and the magnified galaxies behind them. These observations are helping astronomers understand how stars and galaxies emerged out of the dark ages of the Universe, when space was dark, opaque, and filled with hydrogen.

Studying massive galaxy clusters like Abell 370 also helps with measuring the distribution of normal matter and dark matter within such clusters. By studying its lensing properties, astronomers have determined that Abell 370 contains two large, separate clumps of dark matter, contributing to the evidence that this massive galaxy cluster is actually the result of two smaller clusters merging together.

Now that the observations for the Frontier Fields programme are complete, astronomers can use the full dataset to explore the clusters, their gravitational lensing effects and the magnified galaxies from the early Universe in full detail.

Image Credit: NASA, ESA/Hubble, HST Frontier Fields
Explanation from: https://www.spacetelescope.org/news/heic1711/

Colima Volcano Eruption

Colima Volcano Eruption

Colima, Mexico
December 18, 2015

Image Credit: Dario Lopez-Mills/AP

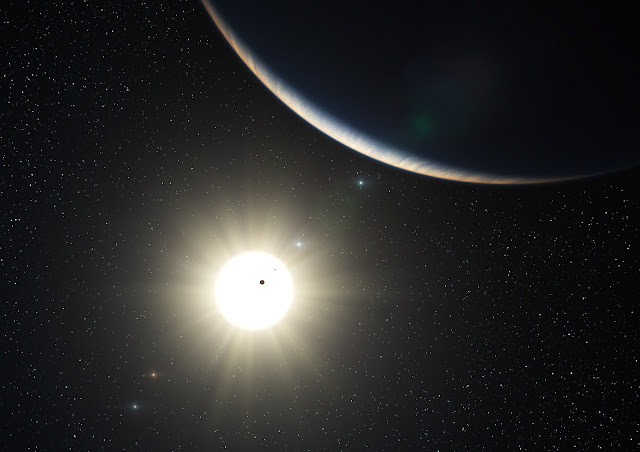
Planetary System HD 10180

Planetary System HD 10180

Astronomers using ESO’s world-leading HARPS instrument have discovered a planetary system containing at least five planets, orbiting the Sun-like star HD 10180. The researchers also have tantalising evidence that two other planets may be present, one of which would have the lowest mass ever found. This would make the system similar to our Solar System in terms of the number of planets (seven as compared to the Solar System’s eight planets). Furthermore, the team also found evidence that the distances of the planets from their star follow a regular pattern, as also seen in our Solar System.

“We have found what is most likely the system with the most planets yet discovered,” says Christophe Lovis, lead author of the paper reporting the result. “This remarkable discovery also highlights the fact that we are now entering a new era in exoplanet research: the study of complex planetary systems and not just of individual planets. Studies of planetary motions in the new system reveal complex gravitational interactions between the planets and give us insights into the long-term evolution of the system.”

The team of astronomers used the HARPS spectrograph, attached to ESO’s 3.6-metre telescope at La Silla, Chile, for a six-year-long study of the Sun-like star HD 10180, located 127 light-years away in the southern constellation of Hydrus (the Male Water Snake). HARPS is an instrument with unrivalled measurement stability and great precision and is the world’s most successful exoplanet hunter.

Thanks to the 190 individual HARPS measurements, the astronomers detected the tiny back and forth motions of the star caused by the complex gravitational attractions from five or more planets. The five strongest signals correspond to planets with Neptune-like masses — between 13 and 25 Earth masses — which orbit the star with periods ranging from about 6 to 600 days. These planets are located between 0.06 and 1.4 times the Earth–Sun distance from their central star.

“We also have good reasons to believe that two other planets are present,” says Lovis. One would be a Saturn-like planet (with a minimum mass of 65 Earth masses) orbiting in 2200 days. The other would be the least massive exoplanet ever discovered, with a mass of about 1.4 times that of the Earth. It is very close to its host star, at just 2 percent of the Earth–Sun distance. One “year” on this planet would last only 1.18 Earth-days.

“This object causes a wobble of its star of only about 3 km/hour— slower than walking speed — and this motion is very hard to measure,” says team member Damien Ségransan. If confirmed, this object would be another example of a hot rocky planet, similar to Corot-7b.

The newly discovered system of planets around HD 10180 is unique in several respects. First of all, with at least five Neptune-like planets lying within a distance equivalent to the orbit of Mars, this system is more populated than our Solar System in its inner region, and has many more massive planets there. Furthermore, the system probably has no Jupiter-like gas giant. In addition, all the planets seem to have almost circular orbits.

So far, astronomers know of fifteen systems with at least three planets. The last record-holder was 55 Cancri, which contains five planets, two of them being giant planets. “Systems of low-mass planets like the one around HD 10180 appear to be quite common, but their formation history remains a puzzle,” says Lovis.

Using the new discovery as well as data for other planetary systems, the astronomers found an equivalent of the Titius–Bode law that exists in our Solar System: the distances of the planets from their star seem to follow a regular pattern. “This could be a signature of the formation process of these planetary systems,” says team member Michel Mayor.

Another important result found by the astronomers while studying these systems is that there is a relationship between the mass of a planetary system and the mass and chemical content of its host star. All very massive planetary systems are found around massive and metal-rich stars, while the four lowest-mass systems are found around lower-mass and metal-poor stars. Such properties confirm current theoretical models.

Image Credit: ESO/L. Calçada
Explanation from: https://www.eso.org/public/news/eso1035/

May 4, 2017

The Small Magellanic Cloud Galaxy

Small Magellanic Cloud Galaxy

The Small Magellanic Cloud galaxy is a striking feature of the southern sky even to the unaided eye. But visible-light telescopes cannot get a really clear view of what is in the galaxy because of obscuring clouds of interstellar dust. VISTA’s infrared capabilities have now allowed astronomers to see the myriad of stars in this neighbouring galaxy much more clearly than ever before. The result is this record-breaking image — the biggest infrared image ever taken of the Small Magellanic Cloud — with the whole frame filled with millions of stars.

The Small Magellanic Cloud (SMC) is a dwarf galaxy, the more petite twin of the Large Magellanic Cloud (LMC). They are two of our closest galaxy neighbours in space — the SMC lies about 200 000 light-years away, just a twelfth of the distance to the more famous Andromeda Galaxy. Both are also rather peculiarly shaped, as a result of interactions with one another and with the Milky Way itself.

Their relative proximity to Earth makes the Magellanic Clouds ideal candidates for studying how stars form and evolve. However, while the distribution and history of star formation in these dwarf galaxies were known to be complex, one of the biggest obstacles to obtaining clear observations of star formation in galaxies is interstellar dust. Enormous clouds of these tiny grains scatter and absorb some of the radiation emitted from the stars — especially visible light — limiting what can be seen by telescopes here on Earth. This is known as dust extinction.

The SMC is full of dust, and the visible light emitted by its stars suffers significant extinction. Fortunately, not all electromagnetic radiation is equally affected by dust. Infrared radiation passes through interstellar dust much more easily than visible light, so by looking at the infrared light from a galaxy we can learn about the new stars forming within the clouds of dust and gas.

VISTA, the Visible and Infrared Survey Telescope, was designed to image infrared radiation. The VISTA Survey of the Magellanic Clouds (VMC) is focused on mapping the star formation history of the SMC and LMC, as well as mapping their three-dimensional structures. Millions of SMC stars have been imaged in the infrared thanks to the VMC, providing an unparalleled view almost unaffected by dust extinction.

The whole frame of this massive image is filled with stars belonging to the Small Magellanic Cloud. It also includes thousands of background galaxies and several bright star clusters, including 47 Tucanae at the right of the picture, which lies much closer to the Earth than the SMC.

The VMC has revealed that most of the stars within the SMC formed far more recently than those in larger neighbouring galaxies. This early result from the survey is just a taster of the new discoveries still to come, as the survey continues to fill in blind spots in our maps of the Magellanic Clouds.

Image Credit: ESO/VISTA VMC
Explanation from: https://www.eso.org/public/news/eso1714/

Kepler's Supernova Remnant

Kepler's Supernova Remnant

A new study using data from NASA's Chandra X-ray Observatory points to the origin of a famous supernova. This supernova, discovered in 1604 by Johannes Kepler, belongs to an important class of objects that are used to measure the rate of expansion of the universe.

Astronomers have used a very long Chandra observation of the remnant of Kepler's supernova to deduce that the supernova was triggered by an interaction between a white dwarf and a red giant star. This is significant because another study has already shown that a so-called Type Ia supernova caused the Kepler supernova remnant.

The thermonuclear explosion of a white dwarf star produces such supernovas. Because they explode with nearly uniform brightness, astronomers have used them as cosmic distance markers to track the accelerated expansion of the universe.

However, there is an ongoing controversy about Type Ia supernovas. Are they caused by a white dwarf pulling so much material from a companion star that it becomes unstable and explodes? Or do they result from the merger of two white dwarfs?

"While we can't speak to all Type Ia supernovas, our evidence points to Kepler being caused by a white dwarf pulling material from a companion star, and not the merger of two white dwarfs," said the first author of the new Chandra study, Mary Burkey of North Carolina State University (NCSU). "To continue improving distance measurements with these supernovas, it is crucial to understand how they are triggered."

The Kepler supernova remnant is one of only a few Type Ia supernovas known to have exploded in the Milky Way galaxy. Its proximity and its identifiable explosion date make it an excellent object to study.

"Johannes Kepler made such good naked-eye observations in 1604 that we can identify the supernova as Type Ia," said co-author Stephen Reynolds, also of NCSU. "He would be thrilled that we can use today's terrific instruments to reveal the hidden secrets of his supernova."

The new Chandra images reveal a disk-shaped structure near the center of the remnant. The researchers interpret this X-ray emission to be caused by the collision between supernova debris and disk-shaped material that the giant star expelled before the explosion. Another possibility is that the structure is just debris from the explosion.

The evidence that this disk-shaped structure was left behind by the giant star is two-fold: first, a substantial amount of magnesium - an element not produced in great amounts in Type Ia supernovas - was found in the Kepler remnant. This suggests the magnesium came from the giant companion star.

Secondly, the disk structure seen by Chandra in X-rays bears a remarkable resemblance in both shape and location to one observed by the Spitzer Space Telescope. These infrared-emitting disks are thought to be dusty bands expelled by stars in a wind, rather than material ejected in a supernova.

The researchers found a remarkably large and puzzling concentration of iron on one side of the center of the remnant but not the other. The authors speculate that the cause of this asymmetry might be the "shadow" in iron that was cast by the companion star, which blocked the ejection of material. Previously, theoretical work has suggested this shadowing is possible for Type Ia supernova remnants.

"One remaining challenge is to find the damaged and fast-moving leftovers of the giant star that was pummeled by the explosion at close quarters," said co-author Kazimierz Borkowski, also of NCSU.

Much of the evidence in the last several years has favored the white dwarf merger scenario for Type Ia supernovas within the Milky Way as well as those found in other galaxies. This result strengthens the case that Type Ia supernovas may have more than one triggering mechanism.

These results could imply that many Type Ia supernovas have a similar origin, but the authors warn that they are unsure whether Kepler was a typical explosion. For example, a recent analysis based on Chandra data and computer simulations, led by Daniel Patnaude from Harvard-Smithsonian Center for Astrophysics, has suggested that Kepler was an unusually powerful explosion.

"We could settle the issue of how normal - or abnormal - the Kepler supernova was if we could discover some light from the supernova explosion that just happened to bounce off some interstellar dust to take a few hundred extra years to get here: a light echo," said Reynolds. Such light echoes have been found for two other galactic supernovas in the last millennium.

Image Credit: X-ray: NASA/CXC/NCSU/M.Burkey et al; Optical: DSS
Explanation from: https://www.nasa.gov/mission_pages/chandra/news/kepler_remnant.html

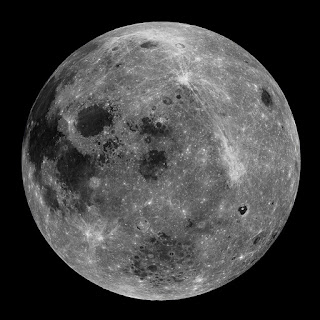
Four views of the Moon

Four views of the MoonFour views of the MoonFour views of the MoonFour views of the Moon

Four views of the Moon from the new WAC 643 nm reflectance mosaic. Upper left: nearside (0°N, 0°E); Upper right: eastern hemisphere (0°N, 90°E); Lower left: farside (0°N, 180°E); Lower right: western hemisphere (0°N, 270°E).

Image Credit: NASA/GSFC/Arizona State University

May 3, 2017

Ara Chloropterus

Ara Chloropterus

The green-winged macaw (Ara chloropterus), also known as the red-and-green macaw, is a large, mostly-red macaw of the Ara genus.

This is the largest of the Ara genus, widespread in the forests and woodlands of northern and central South America. However, in common with other macaws, in recent years there has been a marked decline in its numbers due to habitat loss and illegal capture for the parrot trade.

The green-winged macaw can be readily identified from the scarlet macaw. While the breast of both birds are bright red, the upper-wing covert feathers of the green-winged macaw is mostly green but can occasionally sport a few yellow feathers above the band of green (as opposed to mostly yellow, or a strong mix of yellow and green in the scarlet macaw). In addition, the green-winged macaw has characteristic red lines around the eyes formed by rows of tiny feathers on the otherwise bare white skin patch; this is one of the biggest differences from a scarlet macaw to the casual viewer. Iridescent teal feathers are surrounded by red on the tail. If seen together, the green-winged macaw is clearly larger than the scarlet macaw as well.

In terms of length, this species is second only in size to the hyacinth macaw, the largest of the macaws. The red-and-green macaw attains a total body length of 90 to 95 cm (35 to 37 in) in adults. Twelve adults were found to average 1,214 g (2.676 lb). A weight range of between 1,050 and 1,708 g (2.315 and 3.765 lb) has been reported. While its weight range is broadly similar to that of the hyacinth, the average weight of the red-and-green macaw is slightly surpassed by both the hyacinth and great green macaws, and amongst all living parrots additionally by the kakapo.

Explanation from: https://en.wikipedia.org/wiki/Red-and-green_macaw

Cygnus X

Cygnus X

The stars we see today weren't always as serene as they appear, floating alone in the dark of night. Most stars, likely including our own sun, grew up in cosmic turmoil, as illustrated in this new image from NASA's Spitzer Space Telescope.

The image shows one of the most active and turbulent regions of star birth in our Milky Way galaxy, a region called Cygnus X. The choppy cloud of gas and dust lies 4,500 light-years away in the constellation Cygnus or the "Swan." It is home to thousands of massive stars and many more stars around the size of our sun or smaller. Spitzer has captured an infrared view of the entire region, bubbling with star formation.

"Spitzer captured the range of activities happening in this violent cloud of stellar birth," said Joseph Hora of the Harvard-Smithsonian Center for Astrophysics in Cambridge, Mass., who presented the results today at the 219th meeting of the American Astronomical Society in Austin, Texas. "We see bubbles carved out by massive stars, pillars of new stars, dark filaments lined with stellar embryos and more."

Most stars are thought to form in huge star-forming regions like Cygnus X. Over time, the stars dissipate and migrate away from each other. It's possible that our sun was once packed tightly together with other, more massive stars in a similarly chaotic, though less extreme, region.

The turbulent star-forming clouds are marked with bubbles, or cavities, carved out by radiation and winds from the most massive of stars. Those massive stars tear the cloud material to shreds, terminating the formation of some stars while triggering the birth of others.

"One of the questions we want to answer is how such a violent process can lead to both the death and birth of new stars," said Sean Carey, a team member from NASA's Spitzer Science Center at the California Institute of Technology, Pasadena, Calif. "We still don't know exactly how stars form in such disruptive environments."

Infrared data from Spitzer is helping to answer questions like these by giving astronomers a window into the dustier parts of the complex. Infrared light travels through dust, whereas visible light is blocked. For example, embryonic stars blanketed by dust pop out in the Spitzer observations. In some cases, the young stars are embedded in finger-shaped pillars of dust that line the hollowed out cavities and point toward the central, massive stars. In other cases, these stars can be seen lining very dark, snake-like filaments of thick dust.

Another question scientists hope to answer is how these pillars and filaments are related.

"We have evidence that the massive stars are triggering the birth of new ones in the dark filaments, in addition to the pillars, but we still have more work to do," said Hora.

Infrared light in this image has been color-coded according to wavelength. Light of 3.6 microns is blue, 4.5-micron light is blue-green, 8.0-micron light is green, and 24-micron light is red. These data were taken before the Spitzer mission ran out of its coolant in 2009, and began its "warm" mission.

Image Credit: NASA/JPL-Caltech/Harvard-Smithsonian CfA
Explanation from: http://www.spitzer.caltech.edu/news/1350-ssc2012-02-Before-They-Were-Stars-New-Image-Shows-Space-Nursery

Supernova Remnant W49B

Supernova Remnant W49B

In the supernova remnant W49B, Suzaku found another fossil fireball. It detected X-rays produced when heavily ionized iron atoms recapture an electron. This view combines infrared images from the ground (red, green) with X-ray data from NASA's Chandra X-Ray Observatory (blue).

Image Credit: Caltech/SSC/J. Rho and T. Jarrett and NASA/CXC/SSC/J. Keohane et al.
Explanation from: https://www.nasa.gov/mission_pages/astro-e2/news/fossil-fireballs.html

Volcano Eruption and Aurora

Volcano Eruption and Aurora

Fimmvörðuháls, Iceland

Image Credit & Copyright: James Appleton

Perseus Galaxy Cluster

Perseus Galaxy Cluster

This image is Chandra’s latest view of the Perseus Cluster, where red, green, and blue show low, medium, and high-energy X-rays respectively. It combines data equivalent to more than 17 days worth of observing time taken over a decade with Chandra. The Perseus Cluster is one of the most massive objects in the Universe, and contains thousands of galaxies immersed in an enormous cloud of superheated gas. In Chandra’s X-ray image, enormous bright loops, ripples, and jet-like streaks throughout the cluster can be seen. The dark blue filaments in the center are likely due to a galaxy that has been torn apart and is falling into NGC 1275 (a.k.a. Perseus A), the giant galaxy that lies at the center of the cluster. A different view of Perseus combines data from Chandra in the inner regions of the cluster and XMM data in the outer regions.

Image Credit: X-ray: NASA/CXC/SAO/E.Bulbul, et al.
Explanation from: https://www.nasa.gov/chandra/multimedia/perseus-cluster.html

SOFIA Confirms Nearby Planetary System is Similar to Our Own

Epsilon Eridani
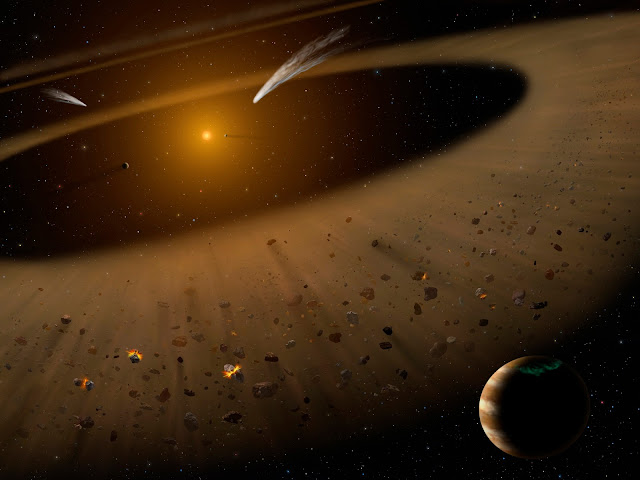
Artist's illustration of the Epsilon Eridani system showing Epsilon Eridani b. In the right foreground, a Jupiter-mass planet is shown orbiting its parent star at the outside edge of an asteroid belt. In the background can be seen another narrow asteroid or comet belt plus an outermost belt similar in size to our Solar System's Kuiper Belt. The similarity of the structure of the Epsilon Eridani system to our Solar System is remarkable, although Epsilon Eridani is much younger than our sun. SOFIA observations confirmed the existence of the asteroid belt adjacent to the orbit of the Jovian planet.

NASA’s flying observatory, the Stratospheric Observatory for Infrared Astronomy, SOFIA, recently completed a detailed study of a nearby planetary system. The investigations confirmed that this nearby planetary system has an architecture remarkably similar to that of our Solar System.

Located 10.5 light-years away in the southern hemisphere of the constellation Eridanus, the star Epsilon Eridani, eps Eri for short, is the closest planetary system around a star similar to the early sun. It is a prime location to research how planets form around stars like our sun, and is also the storied location of the Babylon 5 space station in the science fictional television series of the same name.

Epsilon Eridani
Illustration based on Spitzer observations of the inner and outer parts of the Epsilon Eridani system compared with the corresponding components of our Solar System.

Previous studies indicate that eps Eri has a debris disk, which is the name astronomers give to leftover material still orbiting a star after planetary construction has completed. The debris can take the form of gas and dust, as well as small rocky and icy bodies. Debris disks can be broad, continuous disks or concentrated into belts of debris, similar to our Solar System’s asteroid belt and the Kuiper Belt – the region beyond Neptune where hundreds of thousands of icy-rocky objects reside. Furthermore, careful measurements of the motion of eps Eri indicates that a planet with nearly the same mass as Jupiter circles the star at a distance comparable to Jupiter’s distance from the Sun.

With the new SOFIA images, Kate Su of the University of Arizona and her research team were able to distinguish between two theoretical models of the location of warm debris, such as dust and gas, in the eps Eri system. These models were based on prior data obtained with NASA’s Spitzer space telescope.

One model indicates that warm material is in two narrow rings of debris, which would correspond respectively to the positions of the asteroid belt and the orbit of Uranus in our Solar System. Using this model, theorists indicate that the largest planet in a planetary system might normally be associated with an adjacent debris belt.

The other model attributes the warm material to dust originating in the outer Kuiper-Belt-like zone and filling in a disk of debris toward the central star. In this model, the warm material is in a broad disk, and is not concentrated into asteroid belt-like rings nor is it associated with any planets in the inner region.

Using SOFIA, Su and her team ascertained that the warm material around eps Eri is in fact arranged like the first model suggests; it is in at least one narrow belt rather than in a broad continuous disk.

These observations were possible because SOFIA has a larger telescope diameter than Spitzer, 100 inches (2.5 meters) in diameter compared to Spitzer’s 33.5 inches (0.85 meters), which allowed the team onboard SOFIA to discern details that are three times smaller than what could be seen with Spitzer. Additionally, SOFIA’s powerful mid-infrared camera called FORCAST, the Faint Object infraRed CAmera for the SOFIA Telescope, allowed the team to study the strongest infrared emission from the warm material around eps Eri, at wavelengths between 25-40 microns, which are undetectable by ground-based observatories.

“The high spatial resolution of SOFIA combined with the unique wavelength coverage and impressive dynamic range of the FORCAST camera allowed us to resolve the warm emission around eps Eri, confirming the model that located the warm material near the Jovian planet’s orbit,” said Su. “Furthermore, a planetary mass object is needed to stop the sheet of dust from the outer zone, similar to Neptune’s role in our Solar System. It really is impressive how eps Eri, a much younger version of our Solar System, is put together like ours.”

Image Credit: NASA/SOFIA/Lynette Cook
Explanation from: https://www.nasa.gov/feature/sofia-confirms-nearby-planetary-system-is-similar-to-our-own

May 2, 2017

Zeta Ophiuchi

Zeta Ophiuchi

The blue star near the center of this image is Zeta Ophiuchi. When seen in visible light it appears as a relatively dim red star surrounded by other dim stars and no dust. However, in this infrared image taken with NASA's Wide-field Infrared Survey Explorer, or WISE, a completely different view emerges. Zeta Ophiuchi is actually a very massive, hot, bright blue star plowing its way through a large cloud of interstellar dust and gas.

Astronomers theorize that this stellar juggernaut was likely once part of a binary star system with an even more massive partner. It's believed that when the partner exploded as a supernova, blasting away most of its mass, Zeta Ophiuchi was suddenly freed from its partner's pull and shot away like a bullet moving 24 kilometers per second (54,000 miles per hour). Zeta Ophiuchi is about 20 times more massive and 65,000 times more luminous than the sun. If it weren't surrounded by so much dust, it would be one of the brightest stars in the sky and appear blue to the eye. Like all stars with this kind of extreme mass and power, it subscribes to the 'live fast, die young' motto. It's already about halfway through its very short 8-million-year lifespan. In comparison, the sun is roughly halfway through its 10-billion-year lifespan. While the sun will eventually become a quiet white dwarf, Zeta Ophiuchi, like its ex-partner, will ultimately die in a massive explosion called a supernova.

Perhaps the most interesting features in this image are related to the interstellar gas and dust that surrounds Zeta Ophiuchi. Off to the sides of the image and in the background are relatively calm clouds of dust, appearing green and wispy, slightly reminiscent of the northern lights. Near Zeta Ophiuchi, these clouds look quite different. The cloud in all directions around the star is brighter and redder, because the extreme amounts of ultraviolet radiation emitted by the star are heating the cloud, causing it to glow more brightly in the infrared than usual.

Even more striking, however, is the bright yellow curved feature directly above Zeta Ophiuchi. This is a magnificent example of a bow shock. In this image, the runaway star is flying from the lower right towards the upper left. As it does so, its very powerful stellar wind is pushing the gas and dust out of its way (the stellar wind extends far beyond the visible portion of the star, creating an invisible 'bubble' all around it). And directly in front of the star's path the wind is compressing the gas together so much that it is glowing extremely brightly (in the infrared), creating a bow shock. It is akin to the effect you might see when a boat pushes a wave in front it as it moves through the water. This feature is completely hidden in visible light. Infrared images like this one from WISE shed an entirely new light on the region.

The colors used in this image represent specific wavelengths of infrared light. Blue and cyan (blue-green) represent light emitted at wavelengths of 3.4 and 4.6 microns, which is predominantly from stars. Green and red represent light from 12 and 22 microns, respectively, which is mostly emitted by dust.

Image Credit: NASA/JPL-Caltech/UCLA
Explanation from: https://photojournal.jpl.nasa.gov/catalog/PIA13455

Solar Golden Arches

Sun SDO

The magnetic field lines between a pair of active regions formed a beautiful set of swaying arches rising up above them (April 24-26, 2017). The connection between opposing poles of polarity is visible in exquisite detail in this wavelength of extreme ultraviolet light. What we are really seeing are charged particles spinning along the magnetic field lines. Other field lines are traced as they reach out in other directions as well.

Image Credit: NASA/GSFC/Solar Dynamics Observatory
Explanation from: https://photojournal.jpl.nasa.gov/catalog/PIA21604

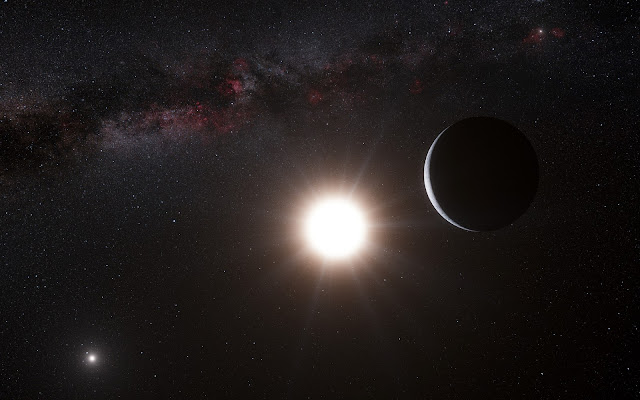
Artist’s impression of the planet around Alpha Centauri B

Artist’s impression of the planet around Alpha Centauri B

This artist’s impression shows the planet orbiting the star Alpha Centauri B, a member of the triple star system that is the closest to Earth. Alpha Centauri B is the most brilliant object in the sky and the other dazzling object is Alpha Centauri A. Our own Sun is visible to the upper right. The tiny signal of the planet was found with the HARPS spectrograph on the 3.6-metre telescope at ESO’s La Silla Observatory in Chile.

Image Credit: ESO/L. Calçada/Nick Risinger
Explanation from: https://www.eso.org/public/images/eso1241a/

A Unique View Of The Moon

The Moon

A huge payoff from the longevity of the LRO mission is the repeat coverage obtained by the LROC Wide Angle Camera (WAC). The WAC has a very wide field-of-view (FOV), 90° in monochrome mode and 60° in multispectral mode, hence its name. On the one hand, the wide FOV enables orbit-to-orbit stereo, which allowed LROC team members at the DLR to create the unprecedented 100 meter scale near-global (0° to 360° longitude and 80°S to 80°N latitude) topographic map of the Moon! However, the wide FOV also poses challenges for mosaicking and reconstructing lunar colors because the perspective changes plus- and minus-30° from the center to the edges of each frame. The problem lies in the fact that the perceived reflectance of the Moon changes as the view angle changes. So for the WAC, the surface appears to be most reflective in the center of the image and less so at the edges, which is quite distracting! This effect results in a pole-to-pole striped image when making a "not-corrected" mosaic.

What to do? Easy - simply take 36 nearly complete global mosaics (110,000 WAC images) and determine an equation that describes how changes in Sun angle and view angle result in reflectance changes. Next step, for each pixel in those 110,000 WAC images compute the solar angle and the viewpoint angle (using the GLD100 to correct for local slopes), and adjust the measured brightness to common angles everywhere on the Moon. For this mosaic the LROC Team used the 643 nm band, a solar angle 10° from vertical (nearly noon), and a viewing angle straight down. Well, perhaps easy is a bit of an exaggeration!

Imagine the number of pixels to consider! To reduce the computational load we use only a subset of the pixels to fit. The most challenging aspect is determining the best photometric model for this huge dataset. Using existing knowledge of lunar reflectance, many iterations, and a variety of classes of mathematical solutions, we ended up using a combination of output from a least-squares fit on a linear model as starting parameters to a minimum search algorithm on a non-linear model. This technique adds robustness to the non-linear model and enables us to more quickly converge on a solution. Or in other words, there were a lot of calculations over many starts and restarts. So perhaps the process was not that easy in practice, but in the end, it was successful! This type of study is known as photometry, and has a rich history going back to the first half of the 20th century.

Image Credit: NASA/GSFC/Arizona State University
Explanation from: http://lroc.sese.asu.edu/posts/707

Cygnus Spacecraft seen from the International Space Station at Sunset

Cygnus Spacecraft seen from the International Space Station at Sunset

On Saturday April 22, 2017, Expedition 51 Flight Engineer Thomas Pesquet of the European Space Agency photographed Orbital ATK's Cygnus spacecraft as it approached the International Space Station. Using the station's robotic Canadarm2, Cygnus was successfully captured by Pesquet and Commander Peggy Whitson at 6:05 a.m. EDT Saturday morning. The spacecraft’s arrival brought more than 7,600 pounds of research and supplies to support Expedition 51 and 52. The Expedition 51 crew worked to offload the new science experiments and crew supplies this week.

Image Credit: ESA/NASA
Explanation from: https://www.nasa.gov/image-feature/cygnus-spacecraft-approaches-space-station-in-the-sunset

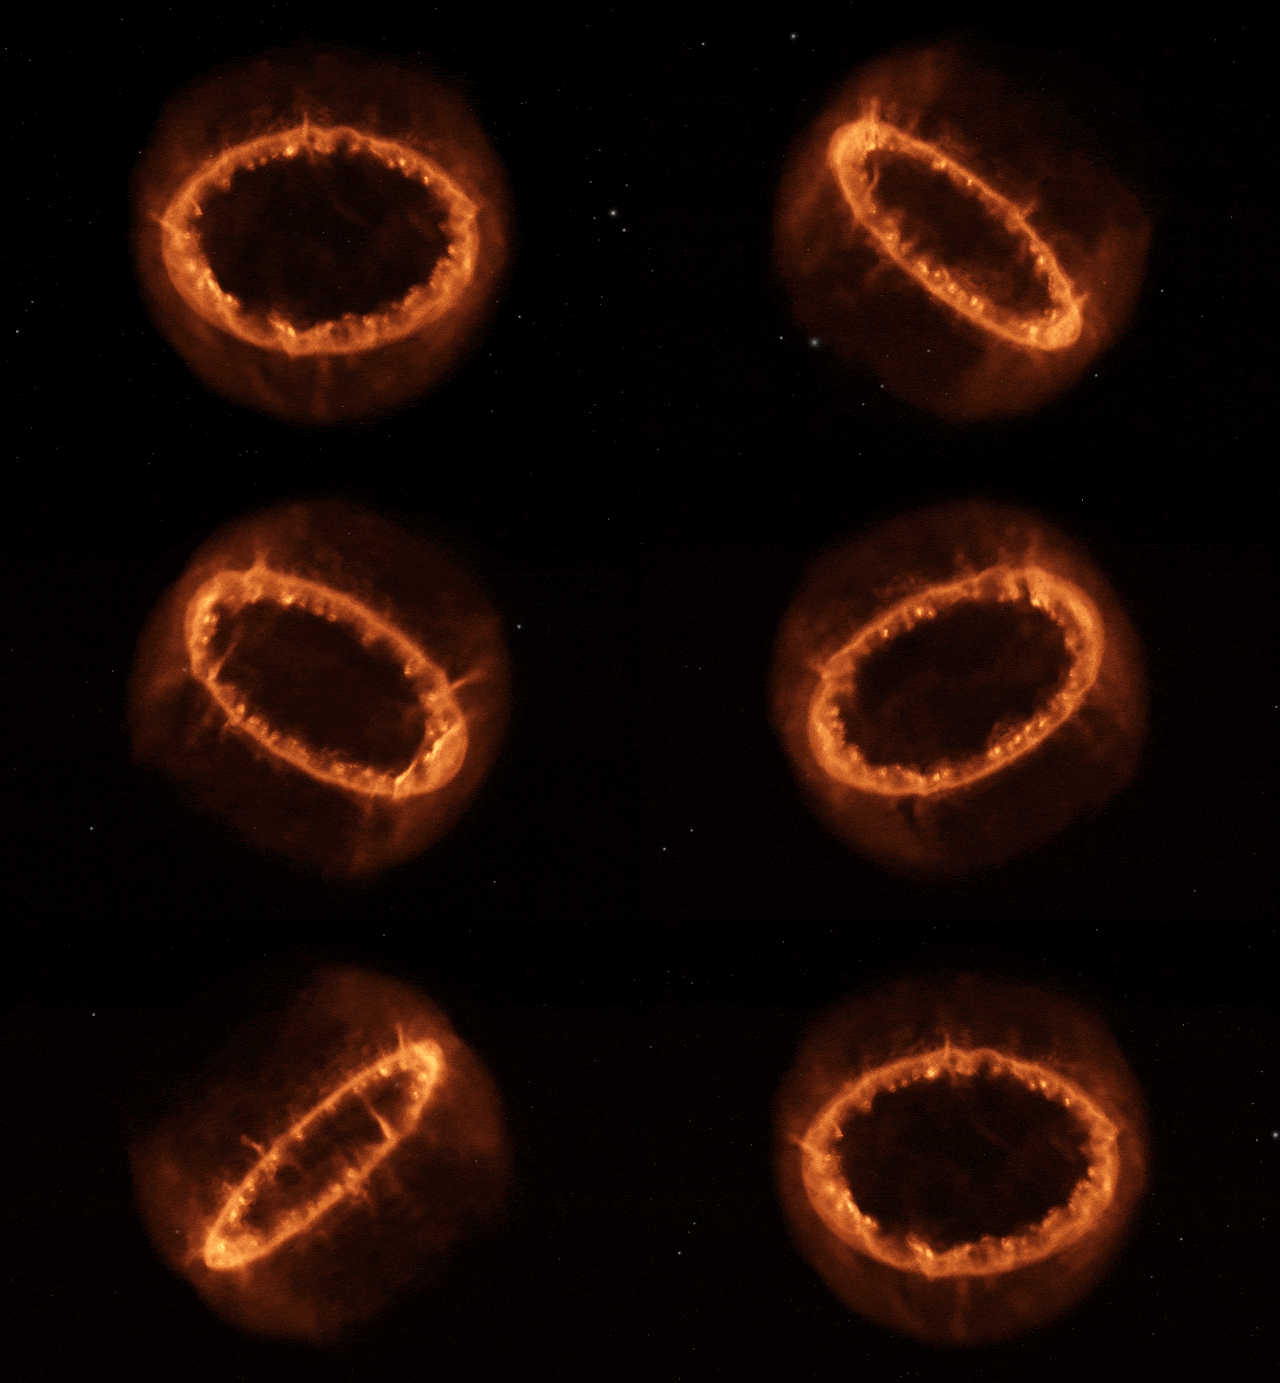
Supernova 1987A

Supernova 1987A

This scientific visualization, using data from a computer simulation, shows Supernova 1987A, as the luminous ring of material we see today.

Image Credit: NASA, ESA, and F. Summers and G. Bacon (STScI), S. Orlando

May 1, 2017

Aurora Borealis

Aurora Borealis

The aurora borealis is a visible display of electrically charged atomic particles from the Sun interacting with Earth’s magnetic field.

Image Credit: Crey

Spiral Galaxy NGC 5917

Spiral Galaxy NGC 5917

This image from Hubble’s Wide Field Camera 3 (WFC3) shows a spiral galaxy NGC 5917, perhaps best known for its intriguing interactions with its neighbouring galaxy MCG-01-39-003 (not visible here, but located off the bottom right of the frame).

Mass is often confused with weight, but they are very different things. Mass is the very substance of an object and is something one always has, no matter the location. If you fly to the Moon and experience low-gravity conditions, your mass has not changed at all. What has actually changed is your weight, because weight is a force caused by the gravitational attraction of another massive body. Gravity is how objects with mass “talk” to one another. People do weigh less on the Moon, but not because they have lost any body mass — the mass of the Moon is less than that of the Earth, so it exerts a smaller gravitational pull on them.

Understanding mass is vital when it comes to understanding why objects behave the way they do in space. Without mass “talking” via gravity, the planets would not orbit the Sun, and galaxies would not interact as NGC 5917 does with its neighbour. Galaxy interactions can lead to very interesting effects; the galaxies can steal mass — in form of stars, dust and gas — from one another, distort and warp one another’s shape, or trigger immense waves of new star formation. Sometimes, a galactic duo interact so strongly that they end up colliding and merging completely. Unfortunately, if NGC 5917 is destined to merge with its celestial neighbour, it will happen much too far into the future for us to enjoy the spectacle.

Image Credit: ESA/Hubble & NASA
Explanation from: https://www.spacetelescope.org/images/potw1718a/

Storm System over East Coast of the United States

Storm System over East Coast of the United States

A vigorous weather system has generated severe weather over the mid-section of the U.S. and satellites are providing a look at it as it is moving toward the East Coast.

NASA and NOAA satellites have been tracking a storm system that has generated flooding and tornadic thunderstorms in the central U.S. and is expected bring severe weather to the U.S. Mid-Atlantic region. At NASA's Goddard Space Flight Center in Greenbelt, Maryland, data from NOAA's GOES-East satellite were used to create images and an animation of the movement of the powerful storm.

On April 30, the Moderate Resolution Imaging Spectroradiometer, or MODIS, instrument aboard NASA's Aqua satellite captured a visible image of the storms moving over eastern Texas and Louisiana. Tornadoes in eastern Texas killed four people. The system generated heavy rainfall and caused additional fatalities and damages in Arkansas, Missouri, Mississippi, Alabama and Tennessee.

On Monday, May 1, NOAA's National Weather Service noted, "Major to record flooding continues over portions of the central U.S. Severe thunderstorms are possible from the Mid-Atlantic to the northeastern U.S."

"Major to record flooding will continue over portions of eastern Oklahoma, northern Arkansas, Missouri, Illinois and Indiana. Rivers will gradually recede over the next several days. Additional strong to severe thunderstorms will be possible Monday afternoon and evening over portions of the Mid-Atlantic and Northeast U.S. Damaging winds, large hail, and isolated tornadoes will be possible."

On May 1 at 10:37 a.m. EDT (1437 UTC) NOAA's GOES-East satellite captured a visible image of the storm system centered over Iowa that showed its associated cold front that stretched into the Gulf of Mexico. That system is expected to bring some severe weather and heavy rainfall from New York state all the way to Florida on May 1.

Image Credit: NASA/NOAA GOES Project
Explanation from: https://www.nasa.gov/feature/goddard/2017/nasa-sees-severe-weather-from-central-to-eastern-us/

Sunset over Atacama Desert

Sunset over Atacama Desert

Captured as the Sun slips below a false horizon of cloud, the sky glows in such a vivid shade of orange that the desert landscape takes on an almost alien appearance. In fact, the Chilean Atacama desert has been used previously by film crews seeking a Mars-like landscape! This other-worldly look is due to the exceptionally arid climate and the site’s complete isolation. The lack of humidity, rain and light pollution together produce both a dusty, rocky landscape and some of the most spectacularly clear skies found anywhere on Earth.

This image was taken by ESO’s Simon Lowery in 2016 from Cerro Armazones, the future home of the Extremely Large Telescope (ELT). The Paranal site, home to the Very Large Telescope (VLT), is just visible beyond the hilltops running across the centre of the frame. The constituent telescopes of the VLT can here be seen alongside the VLT Survey Telescope (VST) on the leftmost hill, whilst the Visible and Infrared Survey Telescope for Astronomy (VISTA) sits on an adjacent peak.

Image Credit: ESO/S. Lowery
Explanation from: https://www.eso.org/public/images/potw1718a/

The north pole of Enceladus

The north pole of Enceladus

In the north, Enceladus' surface appears to be about as old as any in the solar system. The south, however, is an entirely different story.

The north polar area of Enceladus (313 miles or 504 kilometers across) seen here is heavily cratered, an indication that the surface has not been renewed since quite long ago. But the south polar region shows signs of intense geologic activity, most prominently focused around the long fractures known as "tiger stripes" that spray gas and tiny particles from the moon.

This view looks toward the leading side of Enceladus. North on Enceladus is up and rotated 38 degrees to the left. The image was taken in visible light with the Cassini spacecraft narrow-angle camera on Nov. 27, 2016.

The view was acquired at a distance of approximately 20,000 miles (32,000 kilometers) from Enceladus and at a Sun-Enceladus-spacecraft, or phase, angle of 85 degrees. Image scale is 620 feet (190 meters) per pixel.

Image Credit: NASA/JPL-Caltech/Space Science Institute
Explanation from: https://photojournal.jpl.nasa.gov/catalog/PIA21326

Clouds over Pacific Ocean

Clouds over Pacific Ocean

Areas near the equator are frequently cloudy, obscuring the view of Earth’s surface from space. April 7, 2017, was no different. On that day, the Moderate Resolution Imaging Spectroradiometer (MODIS) on NASA’s Terra satellite captured this natural-color image of clouds over the Gilbert Islands. The remote island chain is part of the Republic of Kiribati, and straddles the equator in the central Pacific Ocean.

These clouds, however, were not your typical tropical rainstorm. Instead, the parallel “roll clouds” were likely influenced by the development of Tropical Cyclone Cook to the south. At the time, Cook was strengthening near Vanuatu and heading toward New Caledonia.

“As far as tropical cyclones go, we believe that they are a nearly ideal environment for roll formation,” said Ralph Foster, an atmospheric scientist at the University of Washington. The extreme wind shear associated with cyclones generates additional turbulence in the already turbulent layer of air near Earth’s surface. According to Foster, the turbulent flow in this layer “self-organizes,” forming long rolls of counter-rotating air.

More precisely, the atmosphere has alternating clockwise and counter-clockwise circulation. In between the overturning circulations are updrafts and downdrafts. If conditions are right for clouds to form, clouds will grow in the updraft zone and be suppressed in the downdraft. The resulting linear cloud features can persist for hours.

But just because these convective rolls are happening in the atmosphere does not necessarily mean there will be clouds. “The clouds themselves contribute little to the roll dynamics,” Foster said. “We think of these clouds as convenient flow visualizations.”

The hazy, vertical strip obscuring part of the image is sunlight mirrored from the ocean surface, known as “sunglint.”

Image Credit: NASA, Jeff Schmaltz, LANCE/EOSDIS Rapid Response
Explanation from: https://earthobservatory.nasa.gov/IOTD/view.php?id=90035

April 30, 2017

Kangerlugssuup Sermerssua Glacier

Kangerlugssuup Sermerssua Glacier 

Greenland

Image Credit: Timothy Bartholomaus, Univ. of Idaho

Aurora over Alberta

Aurora over Alberta

Alberta, Canada

Image Credit & Copyright: Sherwin Calaluan

Puyehue-Cordón Caulle Volcano Eruption

Puyehue-Cordón Caulle Volcano Eruption

Osorno, Los Lagos, Chile
June 5, 2011

Image Credit: Ivan Alvarado/Reuters