March 26, 2016

Hubble image of star cluster Messier 15

star cluster Messier 15

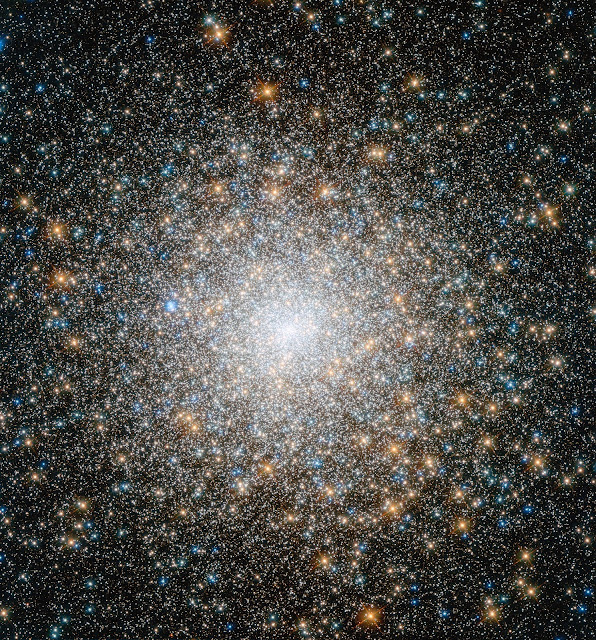
This cluster of stars is known as Messier 15, and is located some 35 000 light-years away in the constellation of Pegasus (The Winged Horse). It is one of the oldest globular clusters known, with an age of around 12 billion years.

Both very hot blue stars and cooler golden stars can be seen swarming together in the image, becoming more concentrated towards the cluster's bright centre. Messier 15 is one of the densest globular clusters known, with most of its mass concentrated at its core. As well as stars, Messier 15 was the first cluster known to host a planetary nebula, and it has been found to have a rare type of black hole at its centre.

This image is made up of observations from Hubble's Wide Field Camera 3 and Advanced Camera for Surveys in the ultraviolet, infrared, and optical parts of the spectrum.

Image Credit: NASA, ESA
Explanation from: https://www.spacetelescope.org/images/heic1321a/

Calbuco Volcano Eruption

Calbuco Volcano Eruption

Puerto Varas, Chile
April 22, 2015

Video Credit & Copyright: Rodrigo Barrera

Panorama of the Milky Way Galaxy above Mt Barney during a massive fire

Panorama of the Milky Way Galaxy above Mt Barney during a massive fire

Scenic Rim Region in Queensland, Australia
September 23, 2013

Image Credit & Copyright: Rob Packer

March 25, 2016

NGC 2683: The UFO Galaxy

NGC 2683

The NASA/ESA Hubble Space Telescope has spotted a UFO — well, the UFO Galaxy, to be precise. NGC 2683 is a spiral galaxy seen almost edge-on, giving it the shape of a classic science fiction spaceship. This is why the astronomers at the Astronaut Memorial Planetarium and Observatory gave it this attention-grabbing nickname.

While a bird’s eye view lets us see the detailed structure of a galaxy, a side-on view has its own perks. In particular, it gives astronomers a great opportunity to see the delicate dusty lanes of the spiral arms silhouetted against the golden haze of the galaxy’s core. In addition, brilliant clusters of young blue stars shine scattered throughout the disc, mapping the galaxy’s star-forming regions.

Perhaps surprisingly, side-on views of galaxies like this one do not prevent astronomers from deducing their structures. Studies of the properties of the light coming from NGC 2683 suggest that this is a barred spiral galaxy, even though the angle we see it at does not let us see this directly.

NGC 2683, discovered on 5 February 1788 by the famous astronomer William Herschel, lies in the Northern constellation of Lynx. A constellation named not because of its resemblance to the feline animal, but because it is fairly faint, requiring the “sensitive eyes of a cat” to discern it. And when you manage to get a look at it, you’ll find treasures like this, making it well worth the effort.

This image is produced from two adjacent fields observed in visible and infrared light by Hubble’s Advanced Camera for Surveys. A narrow strip which appears slightly blurred and crosses most the image horizontally is a result of a gap between Hubble’s detectors. This strip has been patched using images from observations of the galaxy made by ground-based telescopes, which show significantly less detail.

The field of view is approximately 6.5 by 3.3 arcminutes.

Image Credit: ESA/Hubble & NASA
Explanation from: https://www.spacetelescope.org/images/potw1213a/

2012 Total Solar Eclipse seen from Australia

Total Solar Eclipse

Granite, Australia
November 14, 2012

Video Credit & Copyright: Colin Legg

Quadruple star system DI Cha

DI Cha

Two stars shine through the centre of a ring of cascading dust in this image taken by the NASA/ESA Hubble Space Telescope. The star system is named DI Cha, and while only two stars are apparent, it is actually a quadruple system containing two sets of binary stars.

As this is a relatively young star system it is surrounded by dust. The young stars are moulding the dust into a wispy wrap.

The host of this alluring interaction between dust and star is the Chamaeleon I dark cloud — one of three such clouds that comprise a large star-forming region known as the Chamaeleon Complex. DI Cha's juvenility is not remarkable within this region. In fact, the entire system is among not only the youngest but also the closest collections of newly formed stars to be found and so provides an ideal target for studies of star formation.

Image Credit: ESA/Hubble & NASA, Judy Schmidt
Explanation from: http://www.spacetelescope.org/images/potw1543a/

Ant-like Space Structure Previews Death of Our Sun

Ant Nebula

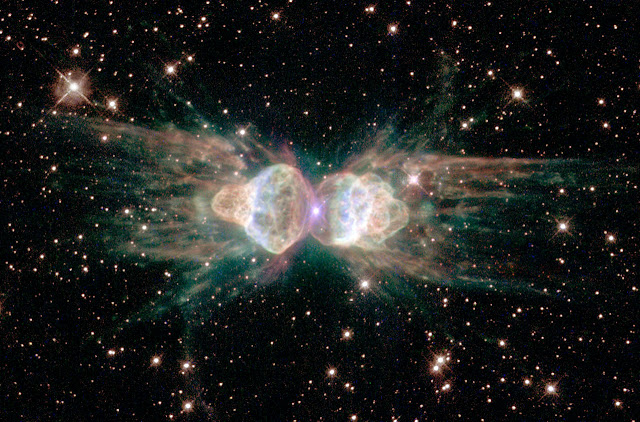
From ground-based telescopes, the so-called "ant nebula" (Menzel 3, or Mz 3) resembles the head and thorax of a garden-variety ant. This dramatic NASA/ESA Hubble Space Telescope image, showing 10 times more detail, reveals the "ant's" body as a pair of fiery lobes protruding from a dying, Sun-like star.

The Hubble images directly challenge old ideas about the last stages in the lives of stars. By observing Sun-like stars as they approach their deaths, the Hubble Heritage image of Mz 3 — along with pictures of other planetary nebulae — shows that our Sun's fate probably will be more interesting, complex, and striking than astronomers imagined just a few years ago.

Though approaching the violence of an explosion, the ejection of gas from the dying star at the center of Mz 3 has intriguing symmetrical patterns unlike the chaotic patterns expected from an ordinary explosion. Scientists using Hubble would like to understand how a spherical star can produce such prominent, non-spherical symmetries in the gas that it ejects.

One possibility is that the central star of Mz 3 has a closely orbiting companion that exerts strong gravitational tidal forces, which shape the outflowing gas. For this to work, the orbiting companion star would have to be close to the dying star, about the distance of the Earth from the Sun. At that distance the orbiting companion star wouldn't be far outside the hugely bloated hulk of the dying star. It's even possible that the dying star has consumed its companion, which now orbits inside of it, much like the duck in the wolf's belly in the story "Peter and the Wolf."

A second possibility is that, as the dying star spins, its strong magnetic fields are wound up into complex shapes like spaghetti in an eggbeater. Charged winds moving at speeds up to 1000 kilometers per second from the star, much like those in our Sun's solar wind but millions of times denser, are able to follow the twisted field lines on their way out into space. These dense winds can be rendered visible by ultraviolet light from the hot central star or from highly supersonic collisions with the ambient gas that excites the material into florescence.

No other planetary nebula observed by Hubble resembles Mz 3 very closely. M2-9 comes close, but the outflow speeds in Mz 3 are up to 10 times larger than those of M2-9. Interestingly, the very massive, young star, Eta Carinae, shows a very similar outflow pattern.

Astronomers Bruce Balick (University of Washington) and Vincent Icke (Leiden University) used Hubble to observe this planetary nebula, Mz 3, in July 1997 with the Wide Field Planetary Camera 2. One year later, astronomers Raghvendra Sahai and John Trauger of the Jet Propulsion Lab in California snapped pictures of Mz 3 using slightly different filters. This intriguing image, which is a composite of several filters from each of the two datasets, was created by the Hubble Heritage Team.

Image Credit: NASA, ESA and The Hubble Heritage Team (STScI/AURA)
Explanation from: http://hubblesite.org/newscenter/archive/releases/2001/05/image/a/

March 24, 2016

NASA, ESA Telescopes find evidence for Asteroid Belt around star Vega

Asteroid Belt around star Vega

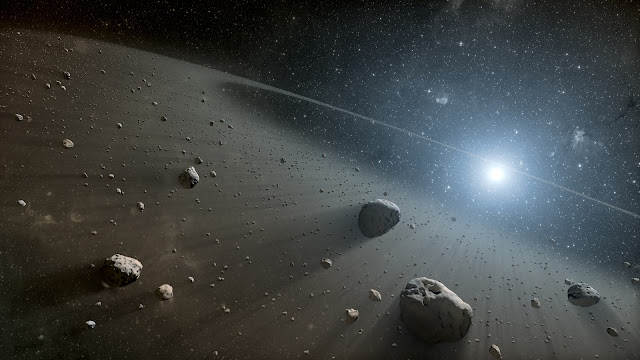
This artist's concept illustrates an asteroid belt around the bright star Vega. Evidence for this warm ring of debris was found using NASA's Spitzer Space Telescope, and the European Space Agency's Herschel Space Observatory, in which NASA plays an important role.

Astronomers have discovered what appears to be a large asteroid belt around the star Vega, the second brightest star in northern night skies. The scientists used data from NASA's Spitzer Space Telescope and the European Space Agency's Herschel Space Observatory, in which NASA plays an important role.

The discovery of an asteroid belt-like band of debris around Vega makes the star similar to another observed star called Fomalhaut. The data are consistent with both stars having inner, warm belts and outer, cool belts separated by a gap. This architecture is similar to the asteroid and Kuiper belts in our own Solar System.

What is maintaining the gap between the warm and cool belts around Vega and Fomalhaut? The results strongly suggest the answer is multiple planets. Our Solar System's asteroid belt, which lies between Mars and Jupiter, is maintained by the gravity of the terrestrial planets and the giant planets, and the outer Kuiper belt is sculpted by the giant planets.

"Our findings echo recent results showing multiple-planet systems are common beyond our sun," said Kate Su, an astronomer at the Steward Observatory at the University of Arizona, Tucson.

Vega and Fomalhaut are similar in other ways. Both are about twice the mass of our sun and burn a hotter, bluer color in visible light. Both stars are relatively nearby, at about 25 light-years away. The stars are thought to be around 400 million years old, but Vega could be closer to its 600 millionth birthday. Fomalhaut has a single candidate planet orbiting it, Fomalhaut b, which orbits at the inner edge of its cometary belt.

The Herschel and Spitzer telescopes detected infrared light emitted by warm and cold dust in discrete bands around Vega and Fomalhaut, discovering the new asteroid belt around Vega and confirming the existence of the other belts around both stars. Comets and the collisions of rocky chunks replenish the dust in these bands. The inner belts in these systems cannot be seen in visible light because the glare of their stars outshines them.

Both the inner and outer belts contain far more material than our own asteroid and Kuiper belts. The reason is twofold: the star systems are far younger than our own, which has had hundreds of millions more years to clean house, and the systems likely formed from an initially more massive cloud of gas and dust than our Solar System.

The gap between the inner and outer debris belts for Vega and Fomalhaut also proportionally corresponds to the distance between our sun's asteroid and Kuiper belts. This distance works out to a ratio of about 1:10, with the outer belt 10 times farther from its host star than the inner belt. As for the large gap between the two belts, it is likely there are several undetected planets, Jupiter-size or smaller, creating a dust-free zone between the two belts. A good comparison star system is HR 8799, which has four known planets that sweep up the space between two similar disks of debris.

"Overall, the large gap between the warm and the cold belts is a signpost that points to multiple planets likely orbiting around Vega and Fomalhaut," said Su.

If unseen planets do, in fact, orbit Vega and Fomalhaut, these bodies will not likely stay hidden.

"Upcoming new facilities such as NASA's James Webb Space Telescope should be able to find the planets," said paper co-author Karl Stapelfeldt, chief of the Exoplanets and Stellar Astrophysics Laboratory at NASA's Goddard Space Flight Center in Greenbelt, Md.

Image Credit: NASA/JPL-Caltech
Explanation from: http://www.nasa.gov/mission_pages/spitzer/multimedia/pia16610.html and http://www.nasa.gov/mission_pages/spitzer/news/spitzervega20130108.html

Raining Loops on the Sun

Coronal Rain

Eruptive events on the Sun can be wildly different. Some come just with a solar flare, some with an additional ejection of solar material called a coronal mass ejection (CME), and some with complex moving structures in association with changes in magnetic field lines that loop up into the Sun's atmosphere, the corona.

On July 19, 2012, an eruption occurred on the Sun that produced all three. A moderately powerful solar flare exploded on the Sun's lower right limb, sending out light and radiation. Next came a CME, which shot off to the right out into space. And then, the Sun treated viewers to one of its dazzling magnetic displays – a phenomenon known as coronal rain.

Over the course of the next day, hot plasma in the corona cooled and condensed along strong magnetic fields in the region. Magnetic fields, themselves, are invisible, but the charged plasma is forced to move along the lines, showing up brightly in the extreme ultraviolet wavelength of 304 Angstroms, which highlights material at a temperature of about 50,000 Kelvin. This plasma acts as a tracer, helping scientists watch the dance of magnetic fields on the Sun, outlining the fields as it slowly falls back to the solar surface.

Video Credit: NASA/SDO/NASA Goddard
Explanation from:http://www.nasa.gov/mission_pages/sdo/news/coronal-rain.html

March 23, 2016

Solar Storms Ignite X-ray "Northern Lights" on Jupiter

jupiter auroraJupiter Northern Lights

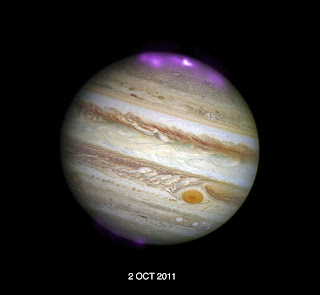
Solar storms are triggering X-ray auroras on Jupiter that are about eight times brighter than normal over a large area of the planet and hundreds of times more energetic than Earth’s "northern lights," according to a new study using data from NASA’s Chandra X-ray Observatory. This result is the first time that Jupiter's auroras have been studied in X-ray light when a giant solar storm arrived at the planet.

The Sun constantly ejects streams of particles into space in the solar wind. Sometimes, giant storms, known as coronal mass ejections (CMEs), erupt and the winds become much stronger. These events compress Jupiter's magnetosphere, the region of space controlled by Jupiter's magnetic field, shifting its boundary with the solar wind inward by more than a million miles. This new study found that the interaction at the boundary triggers the X-rays in Jupiter's auroras, which cover an area bigger than the surface of the Earth.

These composite images show Jupiter and its aurora during and after a CME's arrival at Jupiter in October 2011. In these images, X-ray data from Chandra (purple) have been overlaid on an optical image from the Hubble Space Telescope. The left-hand panel reveals the X-ray activity when the CME reached Jupiter, and the right-hand side is the view two days later after the CME subsided. The impact of the CME on Jupiter's aurora was tracked by monitoring the X-rays emitted during two 11-hour observations. The scientists used that data to pinpoint the source of the X-ray activity and identify areas to investigate further at different time points. They plan to find out how the X-rays form by collecting data on Jupiter's magnetic field, magnetosphere and aurora using Chandra and ESA’s XMM-Newton.

Image Credit: X-ray: NASA/CXC/UCL/W.Dunn et al, Optical: NASA/STScI
Explanation from: https://www.nasa.gov/mission_pages/chandra/solar-storms-ignite-xray-northern-lights-on-jupiter.html

Comparison of the Earth to Saturn

Comparison of the Earth to Saturn

The Earth

Earth is the third planet from the Sun, the densest planet in the Solar System, the largest of the Solar System's four terrestrial planets, and the only astronomical object known to harbor life.

According to evidence from radiometric dating and other sources, Earth was formed about 4.54 billion years ago. Earth gravitationally interacts with other objects in space, especially the Sun and the Moon. During one orbit around the Sun, Earth rotates about its own axis 366.26 times, creating 365.26 solar days or one sidereal year. Earth's axis of rotation is tilted 23.4° away from the perpendicular of its orbital plane, producing seasonal variations on the planet's surface with a period of one tropical year (365.24 solar days). The Moon is Earth's only permanent natural satellite. Its gravitational interaction with Earth causes ocean tides, stabilizes the orientation of Earth's rotational axis, and gradually slows Earth's rotational rate.

Earth's lithosphere is divided into several rigid tectonic plates that migrate across the surface over periods of many millions of years. 71% of Earth's surface is covered with water, with the remainder consisting of continents and islands that together have many lakes and other sources of water that contribute to the hydrosphere. Earth's polar regions are mostly covered with ice, including the Antarctic ice sheet and the sea ice of the Arctic ice pack. Earth's interior remains active with a solid iron inner core, a liquid outer core that generates the magnetic field, and a convecting mantle that drives plate tectonics.

Within its first billion years, life appeared in Earth's oceans and began to affect its atmosphere and surface, promoting the proliferation of aerobic as well as anaerobic organisms. Since then, the combination of Earth's distance from the Sun, its physical properties and its geological history have allowed life to thrive and evolve. The earliest undisputed life on Earth arose at least 3.5 billion years ago. Earlier physical evidence of life includes biogenic graphite in 3.7 billion-year-old metasedimentary rocks discovered in southwestern Greenland, as well as "remains of biotic life" found in 4.1 billion-year-old rocks in Western Australia. Earth's biodiversity has expanded continually except when interrupted by mass extinctions. Although scholars estimate that over 99% of all species of life (over five billion) that ever lived on Earth are extinct, there are still an estimated 10–14 million extant species, of which about 1.2 million have been documented and over 86% have not yet been described. Over 7.3 billion humans live on Earth and depend on its biosphere and minerals for their survival. Earth's human population is divided among about two hundred sovereign states which interact through diplomacy, conflict, travel, trade and communication media.


Saturn

Saturn is the sixth planet from the Sun and the second-largest in the Solar System, after Jupiter. It is a gas giant with an average radius about nine times that of Earth. Although only one-eighth the average density of Earth, with its larger volume Saturn is just over 95 times more massive. Saturn is named after the Roman god of agriculture; its astronomical symbol (♄) represents the god's sickle.

Saturn's interior is probably composed of a core of iron–nickel and rock (silicon and oxygen compounds). This core is surrounded by a deep layer of metallic hydrogen, an intermediate layer of liquid hydrogen and liquid helium, and finally outside the Frenkel line a gaseous outer layer. Saturn has a pale yellow hue due to ammonia crystals in its upper atmosphere. Electrical current within the metallic hydrogen layer is thought to give rise to Saturn's planetary magnetic field, which is weaker than Earth's, but has a magnetic moment 580 times that of Earth due to Saturn's larger size. Saturn's magnetic field strength is around one-twentieth of Jupiter's. The outer atmosphere is generally bland and lacking in contrast, although long-lived features can appear. Wind speeds on Saturn can reach 1,800 km/h (500 m/s), higher than on Jupiter, but not as high as those on Neptune.

Saturn has a prominent ring system that consists of nine continuous main rings and three discontinuous arcs and that is composed mostly of ice particles with a smaller amount of rocky debris and dust. Sixty-two moons are known to orbit Saturn, of which fifty-three are officially named. This does not include the hundreds of moonlets comprising the rings. Titan, Saturn's largest moon, and the second-largest in the Solar System, is larger than the planet Mercury, although less massive, and is the only moon in the Solar System to have a substantial atmosphere.

Explanation from: https://en.wikipedia.org/wiki/Earth and https://en.wikipedia.org/wiki/Saturn

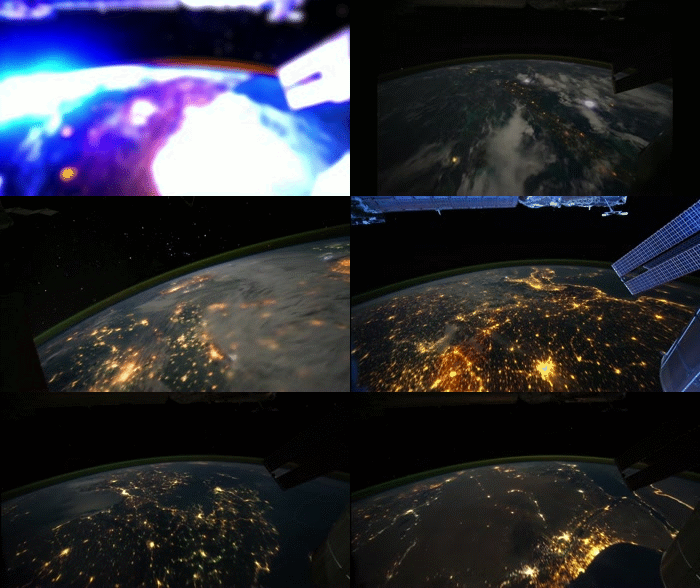
Cities at Night seen from the International Space Station

Cities at Night from ISS

ISS, Orbit of the Earth

Video Credit: ESA/NASA

Lightning Strikes over the Puyehue-Cordón Caulle Volcano

Lightning Strikes over the Puyehue-Cordón Caulle Volcano

Puyehue-Cordón Caulle, Chile
June 6, 2011

Image Credit & Copyright: Francisco Negroni

March 22, 2016

Artist's Impression of the surface of Jupiter's Moon Europa

surface of europa

This artist's concept shows a simulated view from the surface of Jupiter's moon Europa. Europa's potentially rough, icy surface, tinged with reddish areas that scientists hope to learn more about, can be seen in the foreground. The giant planet Jupiter looms over the horizon.

Image Credit: NASA/JPL-Caltech

The Planet full of Water: Mars 4 billion years ago

Water of Mars

This artist’s impression shows how Mars may have looked about four billion years ago. The young planet Mars would have had enough water to cover its entire surface in a liquid layer about 140 metres deep, but it is more likely that the liquid would have pooled to form an ocean occupying almost half of Mars’s northern hemisphere, and in some regions reaching depths greater than 1.6 kilometres.

A primitive ocean on Mars held more water than Earth’s Arctic Ocean, and covered a greater portion of the planet’s surface than the Atlantic Ocean does on Earth, according to new results published today. An international team of scientists used ESO’s Very Large Telescope, along with instruments at the W. M. Keck Observatory and the NASA Infrared Telescope Facility, to monitor the atmosphere of the planet and map out the properties of the water in different parts of Mars’s atmosphere over a six-year period. These new maps are the first of their kind. The results appear online in the journal Science today.

About four billion years ago, the young planet would have had enough water to cover its entire surface in a liquid layer about 140 metres deep, but it is more likely that the liquid would have pooled to form an ocean occupying almost half of Mars’s northern hemisphere, and in some regions reaching depths greater than 1.6 kilometres.

“Our study provides a solid estimate of how much water Mars once had, by determining how much water was lost to space,” said Geronimo Villanueva, a scientist working at NASA’s Goddard Space Flight Center in Greenbelt, Maryland, USA, and lead author of the new paper. “With this work, we can better understand the history of water on Mars.”

The new estimate is based on detailed observations of two slightly different forms of water in Mars’s atmosphere. One is the familiar form of water, made with two hydrogen atoms and one oxygen, H2O. The other is HDO, or semi-heavy water, a naturally occurring variation in which one hydrogen atom is replaced by a heavier form, called deuterium.

As the deuterated form is heavier than normal water, it is less easily lost into space through evaporation. So, the greater the water loss from the planet, the greater the ratio of HDO to H2O in the water that remains.

The researchers distinguished the chemical signatures of the two types of water using ESO’s Very Large Telescope in Chile, along with instruments at the W. M. Keck Observatory and the NASA Infrared Telescope Facility in Hawaii. By comparing the ratio of HDO to H2O, scientists can measure by how much the fraction of HDO has increased and thus determine how much water has escaped into space. This in turn allows the amount of water on Mars at earlier times to be estimated.

In the study, the team mapped the distribution of H2O and HDO repeatedly over nearly six Earth years — equal to about three Mars years — producing global snapshots of each, as well as their ratio. The maps reveal seasonal changes and microclimates, even though modern Mars is essentially a desert.

Ulli Kaeufl of ESO, who was responsible for building one of the instruments used in this study and is a co-author of the new paper, adds: "I am again overwhelmed by how much power there is in remote sensing on other planets using astronomical telescopes: we found an ancient ocean more than 100 million kilometres away!"

The team was especially interested in regions near the north and south poles, because the polar ice caps are the planet’s largest known reservoir of water. The water stored there is thought to document the evolution of Mars’s water from the wet Noachian period, which ended about 3.7 billion years ago, to the present.

The new results show that atmospheric water in the near-polar region was enriched in HDO by a factor of seven relative to Earth’s ocean water, implying that water in Mars’s permanent ice caps is enriched eight-fold. Mars must have lost a volume of water 6.5 times larger than the present polar caps to provide such a high level of enrichment. The volume of Mars’s early ocean must have been at least 20 million cubic kilometres.

Based on the surface of Mars today, a likely location for this water would be the Northern Plains, which have long been considered a good candidate because of their low-lying ground. An ancient ocean there would have covered 19% of the planet’s surface — by comparison, the Atlantic Ocean occupies 17% of the Earth’s surface.

“With Mars losing that much water, the planet was very likely wet for a longer period of time than previously thought, suggesting the planet might have been habitable for longer,” said Michael Mumma, a senior scientist at Goddard and the second author on the paper.

It is possible that Mars once had even more water, some of which may have been deposited below the surface. Because the new maps reveal microclimates and changes in the atmospheric water content over time, they may also prove to be useful in the continuing search for underground water.

Video Credit: ESO/M. Kornmesser
Explanation from: https://www.eso.org/public/videos/eso1509a/ and https://www.eso.org/public/news/eso1509/
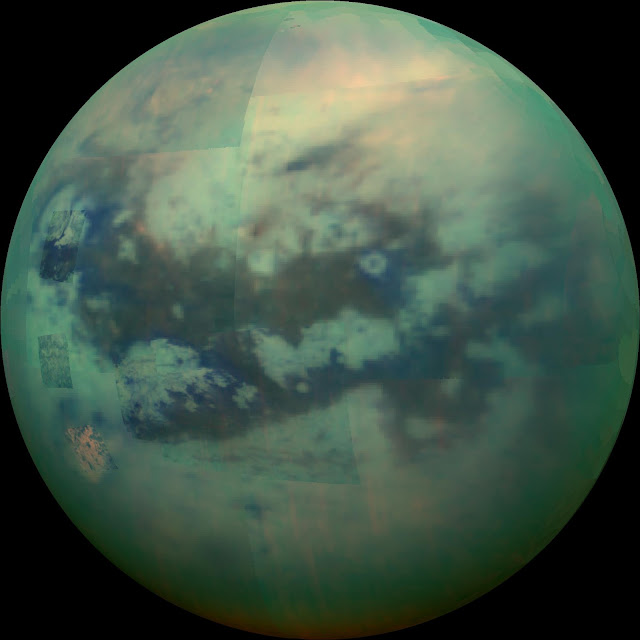
Saturn's moon Titan

titan

This composite image shows an infrared view of Saturn's moon Titan from NASA's Cassini spacecraft, acquired during the mission's "T-114" flyby on November 13, 2015. The spacecraft's visual and infrared mapping spectrometer (VIMS) instrument made these observations, in which blue represents wavelengths centered at 1.3 microns, green represents 2.0 microns, and red represents 5.0 microns. A view at visible wavelengths (centered around 0.5 microns) would show only Titan's hazy atmosphere. The near-infrared wavelengths in this image allow Cassini's vision to penetrate the haze and reveal the moon's surface.

During this Titan flyby, the spacecraft's closest-approach altitude was 6,200 miles (10,000 kilometers), which is considerably higher than those of typical flybys, which are around 750 miles (1,200 kilometers). The high flyby allowed VIMS to gather moderate-resolution views over wide areas (typically at a few kilometers per pixel).

The view looks toward terrain that is mostly on the Saturn-facing hemisphere of Titan. The scene features the parallel, dark, dune-filled regions named Fensal (to the north) and Aztlan (to the south), which form the shape of a sideways letter "H."

Several places on the image show the surface at higher resolution than elsewhere. These areas, called subframes, show more detail because they were acquired near closest approach. They have finer resolution, but cover smaller areas than data obtained when Cassini was farther away from Titan.

Near the limb at left, above center, is the best VIMS view so far of Titan's largest confirmed impact crater, Menrva. Similarly detailed subframes show eastern Xanadu, the basin Hotei Regio, and channels within bright terrains east of Xanadu..

Due to the changing Saturnian seasons, in this late northern spring view, the illumination is significantly changed from that seen by VIMS during the "T-9" flyby on December 26, 2005. The sun has moved higher in the sky in Titan's northern hemisphere, and lower in the sky in the south, as northern summer approaches. This change in the sun's angle with respect to Titan's surface has made high southern latitudes appear darker, while northern latitudes appear brighter.

Image Credit: NASA/JPL/University of Arizona/University of Idaho
Explanation from: http://photojournal.jpl.nasa.gov/catalog/PIA20016

March 21, 2016

Messier 78: a reflection nebula in Orion

Messier 78: a reflection nebula in Orion

This image of the reflection nebula Messier 78 was captured using the Wide Field Imager camera on the MPG/ESO 2.2-metre telescope at the La Silla Observatory, Chile. This colour picture was created from many monochrome exposures taken through blue, yellow/green and red filters, supplemented by exposures through a filter that isolates light from glowing hydrogen gas. The total exposure times were 9, 9, 17.5 and 15.5 minutes per filter, respectively.

Image Credit: ESO/Igor Chekalin
Explanation from: http://www.eso.org/public/images/eso1105a/

Lightning over Grand Canyon National Park

Lightning over Grand Canyon National Park

Grand Canyon, Arizona, USA
August 30, 2013

Image Credit & Copyright: Rex Features and Rolf Maeder

Solar Eruption

Solar Eruption

A solar eruption gracefully rose up from the Sun on December 31, 2012, twisting and turning. Magnetic forces drove the flow of plasma, but without sufficient force to overcome the Sun’s gravity much of the plasma fell back into the Sun.

This four–hour event occurred from 10:20 am to 2:20 pm EST and was captured by NASA’s Solar Dynamics Observatory in extreme ultraviolet light shown here at a high cadence of an image every 36 seconds.

Video Credit: NASA/SDO

March 20, 2016

Colliding galaxies: NGC 6240

NGC 6240

NGC 6240 is a peculiar, butterfly- or lobster-shaped galaxy consisting of two smaller merging galaxies. It lies in the constellation of Ophiuchus, the Serpent Holder, some 400 million light-years away. Observations with NASA's Chandra X-ray Observatory have disclosed two giant black holes, about 3,000 light-years apart, which will drift toward one another and eventually merge together into a larger black hole. The merging process triggered dramatic star formation and sparked numerous supernova explosions. The merger will be complete in some tens to hundreds of millions of years.

This image is part of a large collection of 59 images of merging galaxies taken by the Hubble Space Telescope and released on the occasion of its 18th anniversary on 24th April 2008.

Image Credit: NASA, ESA, the Hubble Heritage Team (STScI/AURA)-ESA/Hubble Collaboration and A. Evans (University of Virginia, Charlottesville/NRAO/Stony Brook University)
Explanation from: https://www.spacetelescope.org/images/heic0810ai/

Comparison of the Earth to the Great Red Spot of Jupiter

Comparison of the Earth to the Great Red Spot of Jupiter

The Earth

Earth is the third planet from the Sun, the densest planet in the Solar System, the largest of the Solar System's four terrestrial planets, and the only astronomical object known to harbor life.

According to evidence from radiometric dating and other sources, Earth was formed about 4.54 billion years ago. Earth gravitationally interacts with other objects in space, especially the Sun and the Moon. During one orbit around the Sun, Earth rotates about its own axis 366.26 times, creating 365.26 solar days or one sidereal year. Earth's axis of rotation is tilted 23.4° away from the perpendicular of its orbital plane, producing seasonal variations on the planet's surface with a period of one tropical year (365.24 solar days). The Moon is Earth's only permanent natural satellite. Its gravitational interaction with Earth causes ocean tides, stabilizes the orientation of Earth's rotational axis, and gradually slows Earth's rotational rate.

Earth's lithosphere is divided into several rigid tectonic plates that migrate across the surface over periods of many millions of years. 71% of Earth's surface is covered with water, with the remainder consisting of continents and islands that together have many lakes and other sources of water that contribute to the hydrosphere. Earth's polar regions are mostly covered with ice, including the Antarctic ice sheet and the sea ice of the Arctic ice pack. Earth's interior remains active with a solid iron inner core, a liquid outer core that generates the magnetic field, and a convecting mantle that drives plate tectonics.

Within its first billion years, life appeared in Earth's oceans and began to affect its atmosphere and surface, promoting the proliferation of aerobic as well as anaerobic organisms. Since then, the combination of Earth's distance from the Sun, its physical properties and its geological history have allowed life to thrive and evolve. The earliest undisputed life on Earth arose at least 3.5 billion years ago. Earlier physical evidence of life includes biogenic graphite in 3.7 billion-year-old metasedimentary rocks discovered in southwestern Greenland, as well as "remains of biotic life" found in 4.1 billion-year-old rocks in Western Australia. Earth's biodiversity has expanded continually except when interrupted by mass extinctions. Although scholars estimate that over 99% of all species of life (over five billion) that ever lived on Earth are extinct, there are still an estimated 10–14 million extant species, of which about 1.2 million have been documented and over 86% have not yet been described. Over 7.3 billion humans live on Earth and depend on its biosphere and minerals for their survival. Earth's human population is divided among about two hundred sovereign states which interact through diplomacy, conflict, travel, trade and communication media.


Great Red Spot

The Great Red Spot is a persistent anticyclonic storm on the planet Jupiter, 22° south of the equator, which has lasted for at least 186 years and possibly as long as 351 years or more. The storm is large enough to be visible through Earth-based telescopes. It was probably first observed by Giovanni Domenico Cassini, who described it around 1665. The spot has been noticeably red at times throughout its observed history, yet has not been appreciably red in the visible spectrum since a rather brief period in the mid 1970s.

Storms such as this are not uncommon within the turbulent atmospheres of gas giants. Jupiter also has white ovals and brown ovals, which are lesser unnamed storms. White ovals tend to consist of relatively cool clouds within the upper atmosphere. Brown ovals are warmer and located within the "normal cloud layer". Such storms can last hours or centuries.

Before the Voyager missions, astronomers were highly uncertain of the Red Spot's nature. Many believed it to be a solid or liquid feature on Jupiter's surface.

Explanation from: https://en.wikipedia.org/wiki/Earth and https://en.wikipedia.org/wiki/Great_Red_Spot

A stellar fingerprint

IRAS 12196-6300

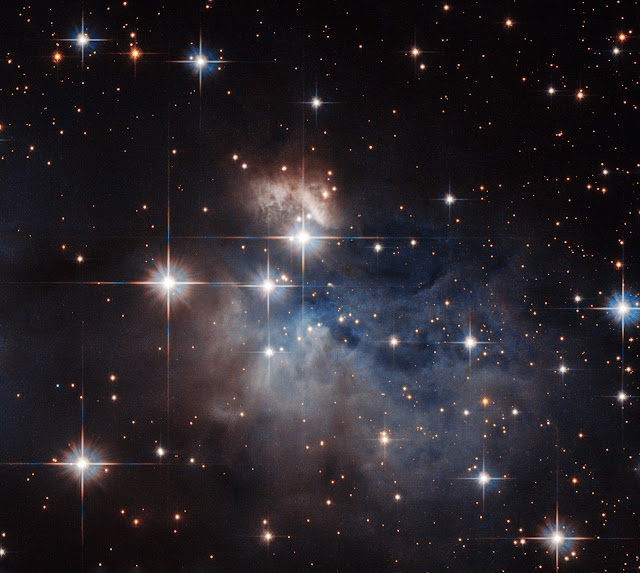
Showcased at the centre of this NASA/ESA Hubble Space Telescope image is an emission-line star known as IRAS 12196-6300.

Located just under 2300 light-years from Earth, this star displays prominent emission lines, meaning that the star’s light, dispersed into a spectrum, shows up as a rainbow of colours marked with a characteristic pattern of dark and bright lines. The characteristics of these lines, when compared to the “fingerprints” left by particular atoms and molecules, can be used to reveal IRAS 12196-6300’s chemical composition.

Under 10 million years old and not yet burning hydrogen at its core, unlike the Sun, this star is still in its infancy. Further evidence of IRAS 12196-6300’s youth is provided by the presence of reflection nebulae. These hazy clouds, pictured floating above and below IRAS 12196-6300, are created when light from a star reflects off a high concentration of nearby dust, such as the dusty material still remaining from IRAS 12196-6300’s formation.

Image Credit: ESA/Hubble & NASA, Judy Schmidt
Explanation from: http://www.spacetelescope.org/images/potw1609a/

R136 observed with WFC3

R136

The image shows the central region of the Tarantula Nebula in the Large Magellanic Cloud. The young and dense star cluster R136 can be seen at the lower right of the image. This cluster contains hundreds of young blue stars, among them the most massive star detected in the Universe so far.

Using the NASA/ESA Hubble Space Telescope astronomers were able to study the central and most dense region of this cluster in detail. Here they found nine stars with more than 100 solar masses.

Image Credit: NASA, ESA, P Crowther (University of Sheffield)
Explanation from: https://www.spacetelescope.org/images/heic1605a/

Earth at Night seen by Suomi NPP satellite

Earth at Night

This global view and animation of Earth's city lights is a composite assembled from data acquired by the Suomi NPP satellite. The data was acquired over nine days in April 2012 and 13 days in October 2012. It took 312 orbits to get a clear shot of every parcel of Earth's land surface and islands. This new data was then mapped over existing Blue Marble imagery of Earth to provide a realistic view of the planet.

Video Credit: NASA Earth Observatory/NOAA NGDC
Explanation from: https://www.nasa.gov/mission_pages/NPP/news/earth-at-night.html