August 26, 2017

Moon's shadow on Earth seen from the International Space Station

Moon's shadow on Earth seen from the International Space Station

As millions of people across the United States experienced a total eclipse as the umbra, or Moon’s shadow passed over them, only six people witnessed the umbra from space. Viewing the eclipse from orbit were NASA’s Randy Bresnik, Jack Fischer and Peggy Whitson, ESA (European Space Agency’s) Paolo Nespoli, and Roscosmos’ Commander Fyodor Yurchikhin and Sergey Ryazanskiy. The space station crossed the path of the eclipse three times as it orbited above the continental United States at an altitude of 250 miles.

Image Credit: NASA
Explanation from: https://www.nasa.gov/image-feature/the-eclipse-2017-umbra-viewed-from-space-1

Uranus seen from Saturn by Cassini spacecraft

Uranus seen from Saturn by Cassini spacecraft

This view from NASA's Cassini spacecraft features a blue planet, but unlike the view from July 19, 2013 that featured our home planet, this blue orb is Uranus, imaged by Cassini for the first time.

Uranus is a pale blue in this natural color image because its visible atmosphere contains methane gas and few aerosols or clouds. Methane on Uranus -- and its sapphire-colored sibling, Neptune -- absorbs red wavelengths of incoming sunlight, but allows blue wavelengths to escape back into space, resulting in the predominantly bluish color seen here. Cassini imaging scientists combined red, green and blue spectral filter images to create a final image that represents what human eyes might see from the vantage point of the spacecraft.

Uranus has been brightened by a factor of 4.5 to make it more easily visible. The outer portion of Saturn's A ring, seen at bottom right, has been brightened by a factor of two. The bright ring cutting across the image center is Saturn's narrow F ring.

Uranus was approximately 28.6 astronomical units from Cassini and Saturn when this view was obtained. An astronomical unit is the average distance from Earth to the sun, equal to 93,000,000 miles (150,000,000 kilometers).

This view was acquired by the Cassini narrow-angle camera at a distance of approximately 614,300 miles (988,600 kilometers) from Saturn on April 11, 2014. Image scale at Uranus is approximately 16,000 miles (25,700 kilometers) per pixel. Image scale at Saturn's rings is approximately 4 miles (6 kilometers) per pixel. In the image, the disk of Uranus is just barely resolved. The solar phase angle at Uranus, seen from Cassini, is 11.9 degrees.

Image Credit: NASA/JPL-Caltech/Space Science Institute
Explanation from: https://photojournal.jpl.nasa.gov/catalog/PIA17178

Artist’s impression of the red supergiant star Antares

Artist’s impression of the red supergiant star Antares

This artist’s impression shows the red supergiant star Antares in the constellation of Scorpius. Using ESO’s Very Large Telescope Interferometer astronomers have constructed the most detailed image ever of this, or any star other than the Sun. Using the same data they have also made the first map of the velocities of material the atmosphere of a star other than the Sun.

Image Credit: ESO/M. Kornmesser
Explanation from: https://www.eso.org/public/images/eso1726b/

Juling Crater, Ceres

Juling Crater, Ceres

This high-resolution image of Juling Crater on Ceres reveals, in exquisite detail, features on the rims and crater floor. The crater is about 1.6 miles (2.5 kilometers) deep and the small mountain, seen left of the center of the crater, is about 0.6 miles (1 kilometers) high. The many features indicative of the flow of material suggest the subsurface is rich in ice. The geological structure of this region, as seen in, also generally suggests that ice is involved.

The origin of the small depression seen at the top of the mountain is not fully understood but might have formed as a consequence of a landslide, visible on the northeastern flank.

Dawn took this image during its extended mission on August 25, 2016, from its low-altitude mapping orbit at a distance of about 240 miles (385 kilometers) above the surface. The center coordinates of this image are 36 degrees south latitude, 167 degrees east longitude.

Juling is named after the Sakai/Orang Asli spirit of the crops from Malaysia.

NASA's Dawn spacecraft acquired this picture on August 24, 2016. The image was taken during Dawn's extended mission, from its low altitude mapping orbit at about 240 miles (385 kilometers) above the surface. The center coordinates of this image are 38 degrees south latitude, 165 degrees east longitude.

Image Credit: NASA/JPL-Caltech/UCLA/MPS/DLR/IDA
Explanation from: https://photojournal.jpl.nasa.gov/catalog/PIA21754

August 25, 2017

Hurricane Harvey seen by NOAA’s GOES East satellite

Hurricane Harvey seen by NOAA’s GOES East satellite

This visible image of Hurricane Harvey taken from NOAA’s GOES East satellite on August 25 at 10:07 a.m. EDT (1407 UTC) clearly showed the storm’s eye as the storm nears landfall in the southeastern coast of Texas.

Image Credit: NASA/NOAA GOES Project

Hurricane Harvey

Hurricane Harvey

The Copernicus Sentinel-3A satellite saw the temperature at the top of Hurricane Harvey on 25 August 2017 at 04:06 GMT as the storm approached the US state of Texas.

The brightness temperature of the clouds at the top of the storm, some 12–15 km above the ocean, range from about –80°C near the eye of the storm to about 20°C at the edges.

Hurricane Harvey

Hurricanes are one of the forces of nature that can be tracked only by satellites, providing up-to-date imagery so that authorities know when to take precautionary measures. Satellites deliver information on a storm’s extent, wind speed and path, and on key features such as cloud thickness, temperature, and water and ice content.

Sentinel-3’s Sea and Land Surface Temperature Radiometer measures energy radiating from Earth’s surface in nine spectral bands and two viewing angles.

Image Credit: NASA/ESA
Explanation from: http://www.esa.int/spaceinimages/Images/2017/08/Hurricane_Harvey

Smoke over Canada seen by Suomi NPP satellite

Smoke over Canada

For more than a month, dozens of large fires have raged in British Columbia. Since early July 2017, wildfire has burned through coniferous forests stressed by heat, drought, and infestations of mountain pine beetles. In early August, another cluster of intense fires flared up in Northwest Territories when a cold front pushed through the region with powerful winds.

The intense fires and persistent southerly winds have wafted extraordinary amounts of smoke north over Canada’s Northwest Territories and Yukon and Nunavut provinces. When the Visible Infrared Imaging Radiometer Suite (VIIRS) on Suomi NPP acquired the data for the image above on August 15, 2017, a heavy pall of smoke drifted over northern Canada. The image is a mosaic composed from several satellite overpasses because the affected area is so large.

A more detailed view of the fires near Lake Athabasca, captured by the Aqua satellite on August 14, 2017, shows smoke streaming north. That smoke joined with another smoke band from fires in British Columbia. The fires in BC were so intense that they produced several pryocumulus clouds, lofting smoke up to 13 kilometers (8 miles) into the atmosphere.

Smoke over Canada

The resulting smoke plumes were thick enough and high enough in the atmosphere to break a record. According to Colin Seftor, an atmospheric researcher for NASA’s Goddard Space Flight Center, the Ozone Mapping and Profiler Suite (OMPS) on Suomi NPP recorded aerosol index (AI) values as high as 49.7 on August 15, 2017—more than 15 points higher than the previous record set in 2006 by fires in Australia. Maximum AI values also broke records on August 14 (49.4) and August 13 (39.9). Aerosols are solid or liquid particles (such as smoke, sea spray, and volcanic ash) that can prevent light from passing through the atmosphere. The satellite aerosol index was first reported in 1978 via measurements from Nimbus-7.

“The aerosol index is affected by both aerosol thickness and altitude,” said Seftor. “Values greater than 6 or 7 often reflect a pyrocumulus event, which can loft smoke high into the stratosphere, where winds can then transport it thousands of miles.” Other circumstances, such as smoke mixing with clouds, can contribute to high AI values.

“If and when the plume drifts over populated areas, it may turn day into night,” added Mike Fromm of the U.S. Naval Research Laboratory. “There’s that much aerosol in the air.”

Scientists expect the smoky aerosols to linger. “Five-day forecasts from the Copernicus Atmosphere Monitoring Service show that large amounts of smoke are expected to extend into the high Arctic over the next few days,” said Mark Parrington of the European Centre for Medium-Range Weather Forecasts.

Image Credit: NASA
Explanation from: https://earthobservatory.nasa.gov/IOTD/view.php?id=90759

The Milky Way Galaxy

The Milky Way Galaxy

This artist's rendering shows a view of our own Milky Way Galaxy and its central bar as it might appear if viewed from above. An arrow indicates the location of our Sun. Astronomers have concluded for many years that our galaxy harbors a stellar bar, though its presence has been inferred indirectly. Our vantage point within the disk of the galaxy makes it difficult to accurately determine the size and shape of this bar and surrounding spiral arms.

New observations by the GLIMPSE legacy team with NASA's Spitzer Space Telescope indicate that the bar-shaped collection of old stars at the center of our galaxy may be longer, and at a different orientation, than previously believed. The newly-deduced size and angle of the bar are shown relative to our Sun's location. Our Milky Way galaxy may appear to be very different from an ordinary spiral galaxy.

Image Credit: NASA/JPL-Caltech/R. Hurt (SSC)
Explanation from: http://www.spitzer.caltech.edu/images/2353-sig05-010a-Milky-Way-Bar

A World of Snowy Dunes on Mars

A World of Snowy Dunes on Mars

It was spring in the Northern hemisphere when this image was taken on May 21, 2017, at 13:21 local Mars time, by the High Resolution Imaging Science Experiment (HiRISE) camera on NASA's Mars Reconnaissance Orbiter. Over the winter, snow and ice have inexorably covered the dunes. Unlike on Earth, this snow and ice is carbon dioxide, better known to us as dry ice.

When the Sun starts shining on it in the spring, the ice on the smooth surface of the dune cracks and escaping gas carries dark sand out from the dune below, often creating beautiful patterns. On the rough surface between the dunes, frost is trapped behind small sheltered ridges.

Image Credit: NASA/JPL/University of Arizona
Explanation from: https://www.nasa.gov/image-feature/jpl/a-world-of-snowy-dunes

August 24, 2017

Best Ever Image of a Star’s Surface and Atmosphere

Antares

Using ESO’s Very Large Telescope Interferometer astronomers have constructed the most detailed image ever of a star — the red supergiant star Antares. They have also made the first map of the velocities of material in the atmosphere of a star other than the Sun, revealing unexpected turbulence in Antares’s huge extended atmosphere.

To the unaided eye the famous, bright star Antares shines with a strong red tint in the heart of the constellation of Scorpius (The Scorpion). It is a huge and comparatively cool red supergiant star in the late stages of its life, on the way to becoming a supernova.

A team of astronomers, led by Keiichi Ohnaka, of the Universidad Católica del Norte in Chile, has now used ESO’s Very Large Telescope Interferometer (VLTI) at the Paranal Observatory in Chile to map Antares’s surface and to measure the motions of the surface material. This is the best image of the surface and atmosphere of any star other than the Sun.

The VLTI is a unique facility that can combine the light from up to four telescopes, either the 8.2-metre Unit Telescopes, or the smaller Auxiliary Telescopes, to create a virtual telescope equivalent to a single mirror up to 200 metres across. This allows it to resolve fine details far beyond what can be seen with a single telescope alone.

“How stars like Antares lose mass so quickly in the final phase of their evolution has been a problem for over half a century,” said Keiichi Ohnaka, who is also the lead author of the paper. “The VLTI is the only facility that can directly measure the gas motions in the extended atmosphere of Antares — a crucial step towards clarifying this problem. The next challenge is to identify what’s driving the turbulent motions.”

Using the new results the team has created the first two-dimensional velocity map of the atmosphere of a star other than the Sun. They did this using the VLTI with three of the Auxiliary Telescopes and an instrument called AMBER to make separate images of the surface of Antares over a small range of infrared wavelengths. The team then used these data to calculate the difference between the speed of the atmospheric gas at different positions on the star and the average speed over the entire star. This resulted in a map of the relative speed of the atmospheric gas across the entire disc of Antares — the first ever created for a star other than the Sun..

The astronomers found turbulent, low-density gas much further from the star than predicted, and concluded that the movement could not result from convection, that is, from large-scale movement of matter which transfers energy from the core to the outer atmosphere of many stars. They reason that a new, currently unknown, process may be needed to explain these movements in the extended atmospheres of red supergiants like Antares.

“In the future, this observing technique can be applied to different types of stars to study their surfaces and atmospheres in unprecedented detail. This has been limited to just the Sun up to now,” concludes Ohnaka. “Our work brings stellar astrophysics to a new dimension and opens an entirely new window to observe stars.”

Image Credit: ESO/K. Ohnaka
Explanation from: https://www.eso.org/public/news/eso1726/

2017 Total Solar Eclipse

2017 Total Solar Eclipse

A total solar eclipse is seen on Monday, August 21, 2017 above Madras, Oregon. A total solar eclipse swept across a narrow portion of the contiguous United States from Lincoln Beach, Oregon to Charleston, South Carolina. A partial solar eclipse was visible across the entire North American continent along with parts of South America, Africa, and Europe.

Image Credit: NASA/Aubrey Gemignani
Explanation from: https://www.nasa.gov/image-feature/2017-total-solar-eclipse

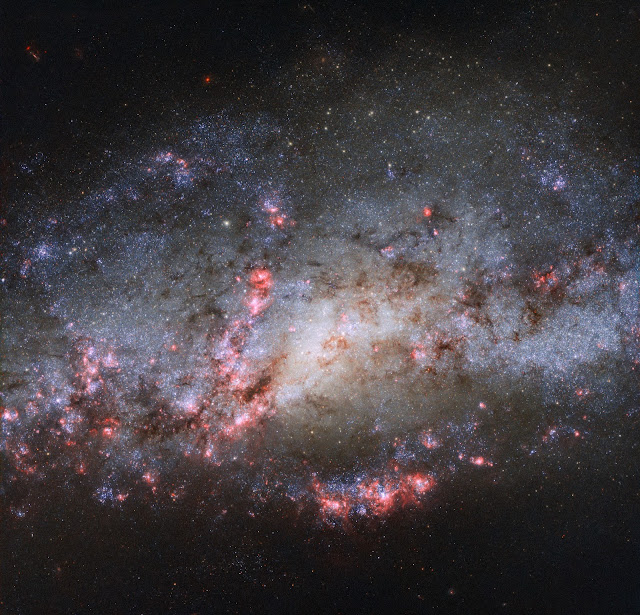
Spiral Galaxy NGC 4490

Spiral Galaxy NGC 4490

This image, taken with the NASA/ESA Hubble Space Telescope, shows the galaxy NGC 4490. The scattered and warped appearance of the galaxy are the result of a past cosmic collision with another galaxy, NGC 4485 (not visible in this image).

The extreme tidal forces of the interaction between the two galaxies have carved out the shapes and properties of NGC 4490. Once a barred spiral galaxy, the outlying regions of NGC 4490 have been stretched out, resulting in its nickname of the Cocoon Galaxy.

Image Credit: ESA/Hubble & NASA
Explanation from: https://www.spacetelescope.org/images/heic17xx-ngc4490a/

August 23, 2017

Solar Eclipse seen by DSCOVR Observatory

Solar Eclipse seen by DSCOVR Observatory

From a million miles out in space, NASA’s Earth Polychromatic Imaging Camera (EPIC) captured 12 natural color images of the moon’s shadow crossing over North America on Aug. 21, 2017. EPIC is aboard NOAA’s Deep Space Climate Observatory (DSCOVR), where it photographs the full sunlit side of Earth every day, giving it a unique view of total solar eclipses. EPIC normally takes about 20 to 22 images of Earth per day, so this animation appears to speed up the progression of the eclipse.

Image Credit: NASA EPIC Team
Explanation from: https://www.nasa.gov/image-feature/goddard/2017/nasas-epic-view-of-2017-eclipse-across-america

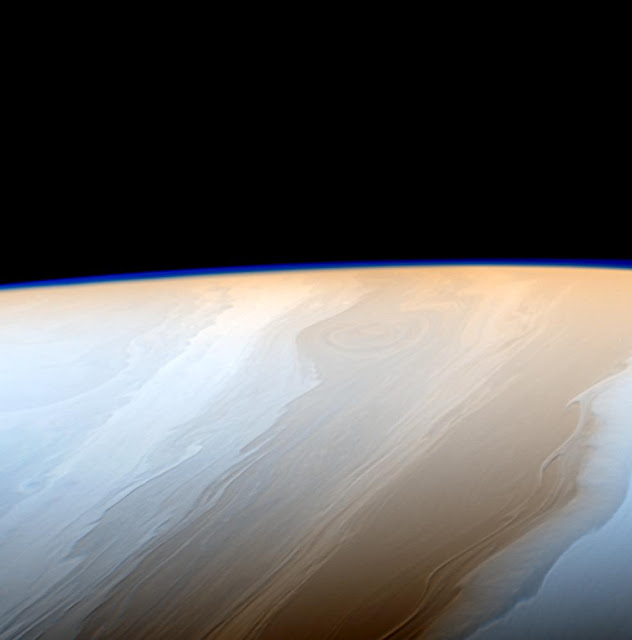
Saturn's Clouds

Saturn's Clouds

Clouds on Saturn take on the appearance of strokes from a cosmic brush thanks to the wavy way that fluids interact in Saturn's atmosphere.

Neighboring bands of clouds move at different speeds and directions depending on their latitudes. This generates turbulence where bands meet and leads to the wavy structure along the interfaces. Saturn's upper atmosphere generates the faint haze seen along the limb of the planet in this image.

This false color view is centered on 46 degrees north latitude on Saturn. The images were taken with the Cassini spacecraft narrow-angle camera on May 18, 2017 using a combination of spectral filters which preferentially admit wavelengths of near-infrared light. The image filter centered at 727 nanometers was used for red in this image; the filter centered at 750 nanometers was used for blue. (The green color channel was simulated using an average of the two filters.)

The view was obtained at a distance of approximately 750,000 miles (1.2 million kilometers) from Saturn. Image scale is about 4 miles (7 kilometers) per pixel.

Image Credit: NASA/JPL-Caltech/Space Science Institute
Explanation from: https://photojournal.jpl.nasa.gov/catalog/PIA21341

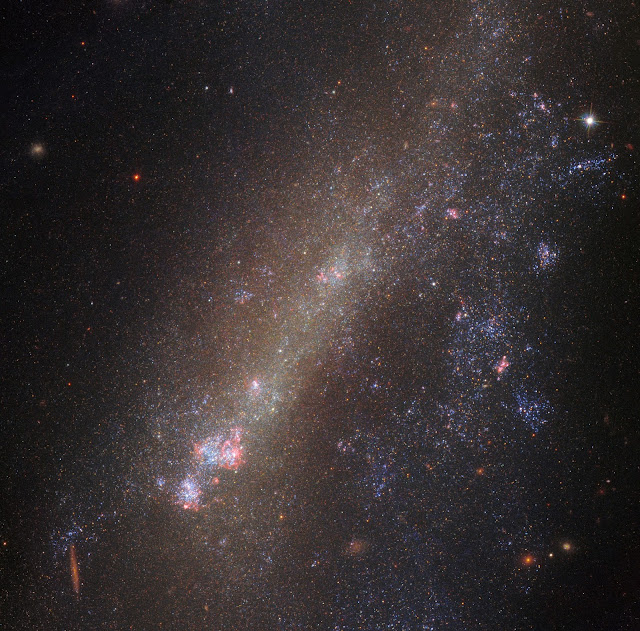
Interacting Galaxy IC 1727

Interacting Galaxy IC 1727

Gravity governs the movements of the cosmos. It draws flocks of galaxies together to form small groups and more massive galaxy clusters, and brings duos so close that they begin to tug at one another. This latter scenario can have extreme consequences, with members of interacting pairs of galaxies often being dramatically distorted, torn apart, or driven to smash into one another, abandoning their former identities and merging to form a single accumulation of gas, dust, and stars.

The subject of this NASA/ESA Hubble Space Telescope image, IC 1727, is currently interacting with its near neighbour, NGC 672 (which is just out of frame). The pair’s interactions have triggered peculiar and intriguing phenomena within both objects — most noticeably in IC 1727. The galaxy’s structure is visibly twisted and asymmetric, and its bright nucleus has been dragged off-centre.

In interacting galaxies such as these, astronomers often see signs of intense star formation (in episodic flurries known as starbursts) and spot newly-formed star clusters. They are thought to be caused by gravity churning, redistributing, and compacting the gas and dust. In fact, astronomers have analysed the star formation within IC 1727 and NGC 672 and discovered something interesting — observations show that simultaneous bursts of star formation occurred in both galaxies some 20 to 30 and 450 to 750 million years ago. The most likely explanation for this is that the galaxies are indeed an interacting pair, approaching each other every so often and swirling up gas and dust as they pass close by.

Image Credit: ESA/Hubble & NASA
Explanation from: https://www.spacetelescope.org/images/potw1733a/

August 22, 2017

Solar Eclipse seen from Oregon

Solar Eclipse seen from Oregon

The last glimmer of the Sun is seen as the Moon makes its final move over the Sun during the total solar eclipse on Monday, August 21, 2017 above Madras, Oregon. A total solar eclipse swept across a narrow portion of the contiguous United States from Lincoln Beach, Oregon to Charleston, South Carolina. A partial solar eclipse was visible across the entire North American continent along with parts of South America, Africa, and Europe.

Image Credit: NASA/Aubrey Gemignani
Explanation from: https://www.nasa.gov/image-feature/last-glimmer-of-the-sun-above-madras-oregon-during-the-2017-total-solar-eclipse

Planetary Nebula IC 5148

Planetary Nebula IC 5148

IC 5148 is a beautiful planetary nebula located some 3000 light-years away in the constellation of Grus (The Crane). The nebula has a diameter of a couple of light-years, and it is still growing at over 50 kilometres per second — one of the fastest expanding planetary nebulae known. The term “planetary nebula” arose in the 19th century, when the first observations of such objects — through the small telescopes available at the time — looked somewhat like giant planets. However, the true nature of planetary nebulae is quite different.

When a star with a mass similar to or a few times more than that of our Sun approaches the end of its life, its outer layers are thrown off into space. The expanding gas is illuminated by the hot remaining core of the star at the centre, forming the planetary nebula, which often takes on a beautiful, glowing shape.

When observed with a smaller amateur telescope, this particular planetary nebula shows up as a ring of material, with the star — which will cool to become a white dwarf — shining in the middle of the central hole. This appearance led astronomers to nickname IC 5148 the Spare Tyre Nebula.

The ESO Faint Object Spectrograph and Camera (EFOSC2) on the New Technology Telescope at La Silla gives a somewhat more elegant view of this object. Rather than looking like a spare tyre, the nebula resembles ethereal blossom with layered petals.

Image Credit: ESO
Explanation from: https://www.eso.org/public/images/potw1242a/

Jupiter

Jupiter

This striking Jovian vista was created by citizen scientists Gerald Eichstädt and Seán Doran using data from the JunoCam imager on NASA's Juno spacecraft.

The tumultuous Great Red Spot is fading from Juno's view while the dynamic bands of the southern region of Jupiter come into focus. North is to the left of the image, and south is on the right.

The image was taken on July 10, 2017 at 7:12 p.m. PDT (10:12 p.m. EDT), as the Juno spacecraft performed its seventh close flyby of Jupiter. At the time the image was taken, the spacecraft was 10,274 miles (16,535 kilometers) from the tops of the clouds of the planet at a latitude of -36.9 degrees.

Image Credit: NASA/JPL-Caltech/SwRI/MSSS/Gerald Eichstadt/Sean Doran
Explanation from: https://photojournal.jpl.nasa.gov/catalog/PIA21778

August 21, 2017

Solar Eclipse seen over Ross Lake

Solar Eclipse seen over Ross Lake

This composite image shows the progression of a partial solar eclipse over Ross Lake, in Northern Cascades National Park, Washington on Monday, August 21, 2017. A total solar eclipse swept across a narrow portion of the contiguous United States from Lincoln Beach, Oregon to Charleston, South Carolina. A partial solar eclipse was visible across the entire North American continent along with parts of South America, Africa, and Europe.

Image Credit: NASA/Bill Ingalls
Explanation from: https://www.nasa.gov/image-feature/glory-of-the-heavens

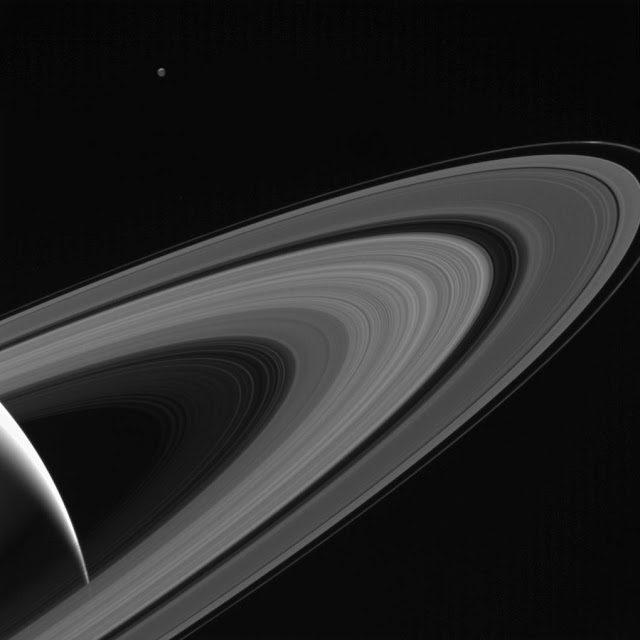
Saturn and Tethys

Saturn and Tethys

NASA's Cassini gazes across the icy rings of Saturn toward the icy moon Tethys, whose night side is illuminated by Saturnshine, or sunlight reflected by the planet.

Tethys was on the far side of Saturn with respect to Cassini here; an observer looking upward from the moon's surface toward Cassini would see Saturn's illuminated disk filling the sky.

Tethys was brightened by a factor of two in this image to increase its visibility. A sliver of the moon's sunlit northern hemisphere is seen at top. A bright wedge of Saturn's sunlit side is seen at lower left.

This view looks toward the sunlit side of the rings from about 10 degrees above the ring plane. The image was taken in visible light with the Cassini spacecraft wide-angle camera on May 13, 2017.

The view was acquired at a distance of approximately 750,000 miles (1.2 million kilometers) from Saturn and at a Sun-Saturn-spacecraft, or phase, angle of 140 degrees. Image scale is 43 miles (70 kilometers) per pixel on Saturn. The distance to Tethys was about 930,000 miles (1.5 million kilometers). The image scale on Tethys is about 56 miles (90 kilometers) per pixel.

Image Credit: NASA/JPL-Caltech/Space Science Institute
Explanation from: https://photojournal.jpl.nasa.gov/catalog/PIA21342

Dwarf Galaxy NGC 178

Dwarf Galaxy NGC 178

NGC 178 may be small, but it packs quite a punch. Measuring around 40 000 light-years across, its diameter is less than half that of the Milky Way, and it is accordingly classified as a dwarf galaxy. Despite its diminutive size, NGC 178 is busy forming new stars. On average, the galaxy forms stars totalling around half the mass of the Sun per year — enough to label it a starburst galaxy.

The galaxy’s discovery is an interesting, and somewhat confusing, story. It was originally discovered by American astronomer Ormond Stone in 1885 and dubbed NGC 178, but its position in the sky was recorded incorrectly — by accident the value for the galaxy’s right ascension (which can be thought of as the celestial equivalent of terrestrial longitude) was off by a considerable amount.

In the years that followed NGC 178 was spotted again, this time by French astronomer Stéphane Javelle. As no catalogued object occupied that position in the sky, Javelle believed he had discovered a new galaxy and entered it into the expanded Index Catalogue under the name IC 39. Later, American astronomer Herbert Howe also observed the object and corrected Stone’s initial mistake. Many years later, astronomers finally noticed that NGC 178 and IC 39 were actually the same object!

This image of NGC 178 comprises data gathered by the Wide Field Planetary Camera 2 aboard the NASA/ESA Hubble Space Telescope.

Image Credit: ESA/Hubble & NASA
Explanation from: https://www.spacetelescope.org/images/potw1734a/

August 20, 2017

The Bahamas seen from the International Space Station

The Bahamas seen from the International Space Station

One of the most recognizable points on the Earth for astronauts to photograph is the Bahamas, captured in striking images many times from the vantage point of the International Space Station. Expedition 52 Flight Engineer Randy Bresnik of NASA took this photo on Aug. 13, 2017.

Image Credit: NASA
Explanation from: https://www.nasa.gov/image-feature/space-station-flight-over-the-bahamas

Brown Dwarf Weather

Brown Dwarf Weather
This artist's concept shows a brown dwarf with bands of clouds, thought to resemble those seen at Neptune and the other outer planets.

Dim objects called brown dwarfs, less massive than the Sun but more massive than Jupiter, have powerful winds and clouds -- specifically, hot patchy clouds made of iron droplets and silicate dust. Scientists recently realized these giant clouds can move and thicken or thin surprisingly rapidly, in less than an Earth day, but did not understand why.

Now, researchers have a new model for explaining how clouds move and change shape in brown dwarfs, using insights from NASA's Spitzer Space Telescope. Giant waves cause large-scale movement of particles in brown dwarfs' atmospheres, changing the thickness of the silicate clouds, researchers report in the journal Science. The study also suggests these clouds are organized in bands confined to different latitudes, traveling with different speeds in different bands.

"This is the first time we have seen atmospheric bands and waves in brown dwarfs," said lead author Daniel Apai, associate professor of astronomy and planetary sciences at the University of Arizona in Tucson.

Just as in Earth’s ocean, different types of waves can form in planetary atmospheres. For example, in Earth’s atmosphere, very long waves mix cold air from the polar regions to mid-latitudes, which often lead clouds to form or dissipate.

The distribution and motions of the clouds on brown dwarfs in this study are more similar to those seen on Jupiter, Saturn, Uranus and Neptune. Neptune has cloud structures that follow banded paths too, but its clouds are made of ice. Observations of Neptune from NASA's Kepler spacecraft, operating in its K2 mission, were important in this comparison between the planet and brown dwarfs.

"The atmospheric winds of brown dwarfs seem to be more like Jupiter’s familiar regular pattern of belts and zones than the chaotic atmospheric boiling seen on the Sun and many other stars," said study co-author Mark Marley at NASA's Ames Research Center in California's Silicon Valley.

Brown dwarfs can be thought of as failed stars because they are too small to fuse chemical elements in their cores. They can also be thought of as "super planets" because they are more massive than Jupiter, yet have roughly the same diameter. Like gas giant planets, brown dwarfs are mostly made of hydrogen and helium, but they are often found apart from any planetary systems. In a 2014 study using Spitzer, scientists found that brown dwarfs commonly have atmospheric storms.

Due to their similarity to giant exoplanets, brown dwarfs are windows into planetary systems beyond our own. It is easier to study brown dwarfs than planets because they often do not have a bright host star that obscures them.

"It is likely the banded structure and large atmospheric waves we found in brown dwarfs will also be common in giant exoplanets," Apai said.

Using Spitzer, scientists monitored brightness changes in six brown dwarfs over more than a year, observing each of them rotate 32 times. As a brown dwarf rotates, its clouds move in and out of the hemisphere seen by the telescope, causing changes in the brightness of the brown dwarf. Scientists then analyzed these brightness variations to explore how silicate clouds are distributed in the brown dwarfs.

Researchers had been expecting these brown dwarfs to have elliptical storms resembling Jupiter's Great Red Spot, caused by high-pressure zones. The Great Red Spot has been present in Jupiter for hundreds of years and changes very slowly: Such "spots" could not explain the rapid changes in brightness that scientists saw while observing these brown dwarfs. The brightness levels of the brown dwarfs varied markedly just over the course of an Earth day.

To make sense of the ups and downs of brightness, scientists had to rethink their assumptions about what was going on in the brown dwarf atmospheres. The best model to explain the variations involves large waves, propagating through the atmosphere with different periods. These waves would make the cloud structures rotate with different speeds in different bands.

University of Arizona researcher Theodora Karalidi used a supercomputer and a new computer algorithm to create maps of how clouds travel on these brown dwarfs.

"When the peaks of the two waves are offset, over the course of the day there are two points of maximum brightness," Karalidi said. "When the waves are in sync, you get one large peak, making the brown dwarf twice as bright as with a single wave."

The results explain the puzzling behavior and brightness changes that researchers previously saw. The next step is to try to better understand what causes the waves that drive cloud behavior.

Image Credit: NASA/JPL-Caltech
Explanation from: https://www.nasa.gov/feature/jpl/scientists-improve-brown-dwarf-weather-forecasts

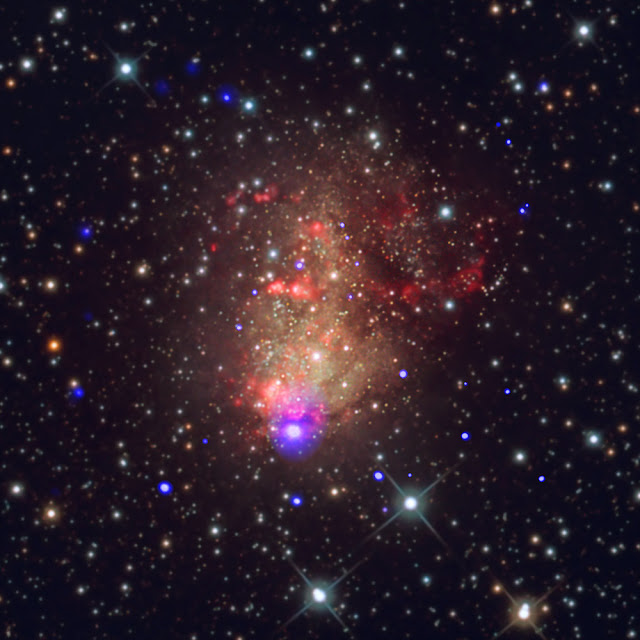
IC 10: A Starburst Galaxy with the Prospect of Gravitational Waves

IC 10: A Starburst Galaxy with the Prospect of Gravitational Waves

  • Chandra observations of the IC 10 starburst galaxy reveal about 110 X-ray sources.
  • Of these, about a dozen are systems where a black hole or neutron star is pulling material away from a young, massive companion star.
  • Some of these pairs may eventually form systems that merge and emit gravitational waves.
  • This new composite contains X-rays from Chandra (dark blue) combined with an optical image from an astrophotographer (red, green, blue).

In 1887, American astronomer Lewis Swift discovered a glowing cloud, or nebula, that turned out to be a small galaxy about 2.2 million light years from Earth. Today, it is known as the "starburst" galaxy IC 10, referring to the intense star formationactivity occurring there.

More than a hundred years after Swift's discovery, astronomers are studying IC 10 with the most powerful telescopes of the 21st century. New observations with NASA's Chandra X-ray Observatory reveal many pairs of stars that may one day become sources of perhaps the most exciting cosmic phenomenon observed in recent years: gravitational waves.

By analyzing Chandra observations of IC 10 spanning a decade, astronomers found over a dozen black holes and neutron stars feeding off gas from young, massive stellar companions. Such double star systems are known as "X-ray binaries" because they emit large amounts of X-ray light. As a massive star orbits around its compact companion, either a black hole or neutron star, material can be pulled away from the giant star to form a disk of material around the compact object. Frictional forces heat the infalling material to millions of degrees, producing a bright X-ray source.

When the massive companion star runs out of fuel, it will undergo a catastrophic collapse that will produce a supernova explosion, and leave behind a black hole or neutron star. The end result is two compact objects: either a pair of black holes, a pair of neutron stars, or a black hole and neutron star. If the separation between the compact objects becomes small enough as time passes, they will produce gravitational waves. Over time, the size of their orbit will shrink until they merge. LIGO has found three examples of black hole pairs merging in this way in the past two years.

Starburst galaxies like IC 10 are excellent places to search for X-ray binaries because they are churning out stars rapidly. Many of these newly born stars will be pairs of young and massive stars. The most massive of the pair will evolve more quickly and leave behind a black hole or a neutron star partnered with the remaining massive star. If the separation of the stars is small enough, an X-ray binary system will be produced.

This new composite image of IC 10 combines X-ray data from Chandra (blue) with an optical image (red, green, blue) taken by amateur astronomer Bill Snyder from the Heavens Mirror Observatory in Sierra Nevada, California. The X-ray sources detected by Chandra appear as a darker blue than the stars detected in optical light.

The young stars in IC 10 appear to be just the right age to give a maximum amount of interaction between the massive stars and their compact companions, producing the most X-ray sources. If the systems were younger, then the massive stars would not have had time to go supernova and produce a neutron star or black hole, or the orbit of the massive star and the compact object would not have had time to shrink enough for mass transfer to begin. If the star system were much older, then both compact objects would probably have already formed. In this case transfer of matter between the compact objects is unlikely, preventing the formation of an X-ray emitting disk.

Chandra detected 110 X-ray sources in IC 10. Of these, over forty are also seen in optical light and 16 of these contain "blue supergiants", which are the type of young, massive, hot stars described earlier. Most of the other sources are X-ray binaries containing less massive stars. Several of the objects show strong variability in their X-ray output, indicative of violent interactions between the compact stars and their companions.

Image Credit: X-ray: NASA/CXC/UMass Lowell/S.Laycock et al. Optical: Bill Snyder Astrophotography
Explanation from: http://chandra.harvard.edu/photo/2017/ic10/