April 28, 2017

Zodiacal Light and the Milky Way Galaxy

Zodiacal Light and the Milky Way Galaxy

In this incredible panorama, the night sky above ESO’s Very Large Telescope (VLT) displays our cosmic neighbourhood in all its glory.

The VLT is located 2635 metres above sea level at ESO’s Paranal Observatory in northern Chile. This image illustrates the importance, and the benefits, of placing astronomical telescopes in such remote places! Anyone making the long journey to the site — including ESO Photo Ambassador Petr Horálek, who captured this scene — is rewarded with a truly spectacular view.

On the right, behind the line of four 8.2-metre Unit Telescopes that together make up the VLT, the faint red and green hues of airglow can be seen illuminating the sky above the horizon. In addition zodiacal light is illuminating the sky as well. This diffuse light is caused by microscopic particles of light-scattering space dust in the plane of the Solar System.

While these features are beautiful, the most striking element of this image is undeniably the arc of the Milky Way. The bright arch of our home galaxy is peppered with dark filaments of dust, which absorb and obscure the light from the stars behind them, and bright patches where new stars are forming.

Just beneath the Milky Way lie two of our small galactic neighbours, the Large and Small Magellanic Clouds, and beneath them sit two of the VLT’s smaller 1.8-metre Auxiliary Telescopes.

Image Credit: P. Horálek/ESO
Explanation from: https://www.eso.org/public/images/potw1717a/

Exoplanet HD 219134b

Exoplanet  HD 219134b

This artist's rendition shows one possible appearance for the planet HD 219134b, the nearest confirmed rocky exoplanet found to date outside our Solar System. The planet is 1.6 times the size of Earth, and whips around its star in just three days. Scientists predict that the scorching-hot planet -- known to be rocky through measurements of its mass and size -- would have a rocky, partially molten surface with geological activity, including possibly volcanoes.

Image Credit: NASA/JPL-Caltech
Explanation from: https://photojournal.jpl.nasa.gov/catalog/PIA19833

The north pole of the Moon

The north pole of the Moon

The Earth's Moon has been an endless source of fascination for humanity for thousands of years. When at last Apollo 11 landed on the Moon's surface in 1969, the crew found a desolate, lifeless orb, but one which still fascinates scientist and non-scientist alike.

This image of the Moon's north polar region was taken by the Lunar Reconnaissance Orbiter Camera, or LROC. One of the primary scientific objectives of LROC is to identify regions of permanent shadow and near-permanent illumination. Since the start of the mission, LROC has acquired thousands of Wide Angle Camera images approaching the north pole. From these images, scientists produced this mosaic, which is composed of 983 images taken over a one month period during northern summer. This mosaic shows the pole when it is best illuminated, regions that are in shadow are candidates for permanent shadow.

Image Credit: NASA/GSFC/Arizona State University
Explanation from: https://www.nasa.gov/multimedia/imagegallery/image_feature_2054.html

April 27, 2017

NASA Spacecraft Dives Between Saturn and Its Rings

Saturn's atmosphereSaturn's atmosphereSaturn's atmosphere

NASA's Cassini spacecraft is back in contact with Earth after its successful first-ever dive through the narrow gap between the planet Saturn and its rings on April 26, 2017. The spacecraft is in the process of beaming back science and engineering data collected during its passage, via NASA's Deep Space Network Goldstone Complex in California's Mojave Desert. The DSN acquired Cassini's signal at 11:56 p.m. PDT on April 26, 2017 (2:56 a.m. EDT on April 27) and data began flowing at 12:01 a.m. PDT (3:01 a.m. EDT) on April 27.

"In the grandest tradition of exploration, NASA's Cassini spacecraft has once again blazed a trail, showing us new wonders and demonstrating where our curiosity can take us if we dare," said Jim Green, director of the Planetary Science Division at NASA Headquarters in Washington.

As it dove through the gap, Cassini came within about 1,900 miles (3,000 kilometers) of Saturn's cloud tops (where the air pressure is 1 bar -- comparable to the atmospheric pressure of Earth at sea level) and within about 200 miles (300 kilometers) of the innermost visible edge of the rings.

While mission managers were confident Cassini would pass through the gap successfully, they took extra precautions with this first dive, as the region had never been explored.

"No spacecraft has ever been this close to Saturn before. We could only rely on predictions, based on our experience with Saturn's other rings, of what we thought this gap between the rings and Saturn would be like," said Cassini Project Manager Earl Maize of NASA's Jet Propulsion Laboratory in Pasadena, California. "I am delighted to report that Cassini shot through the gap just as we planned and has come out the other side in excellent shape."

The gap between the rings and the top of Saturn's atmosphere is about 1,500 miles (2,000 kilometers) wide. The best models for the region suggested that if there were ring particles in the area where Cassini crossed the ring plane, they would be tiny, on the scale of smoke particles. The spacecraft zipped through this region at speeds of about 77,000 mph (124,000 kph) relative to the planet, so small particles hitting a sensitive area could potentially have disabled the spacecraft.

As a protective measure, the spacecraft used its large, dish-shaped high-gain antenna (13 feet or 4 meters across) as a shield, orienting it in the direction of oncoming ring particles. This meant that the spacecraft was out of contact with Earth during the ring-plane crossing, which took place at 2 a.m. PDT (5 a.m. EDT) on April 26. Cassini was programmed to collect science data while close to the planet and turn toward Earth to make contact about 20 hours after the crossing.

Cassini's next dive through the gap is scheduled for May 2.

Launched in 1997, Cassini arrived at Saturn in 2004. Following its last close flyby of the large moon Titan on April 21 PDT (April 22 EDT), Cassini began what mission planners are calling its "Grand Finale." During this final chapter, Cassini loops Saturn approximately once per week, making a total of 22 dives between the rings and the planet. Data from this first dive will help engineers understand if and how they will need to protect the spacecraft on its future ring-plane crossings. The spacecraft is on a trajectory that will eventually plunge into Saturn's atmosphere -- and end Cassini's mission -- on Sept. 15, 2017.

Image Credit: NASA/JPL-Caltech/Space Science Institute
Explanation from: https://www.nasa.gov/feature/jpl/nasa-spacecraft-dives-between-saturn-and-its-rings

Aurora over Antarctica

Aurora over Antarctica

It is cold, dark, dry and isolated with very little oxygen to breathe in the air, but the unique location makes Concordia station in Antarctica an attractive place for scientists to conduct research. The aurora australis that adds colour to this picture is a well-deserved bonus for the crew of 13 who are spending the winter months cut off from friends and family.

For nine months, no aircraft or land vehicles can reach the station, temperatures drop to –80°C and the Sun does not rise above the horizon for 100 days. Living and working in these conditions is similar in many respects to living on another planet and ESA sponsors a medical doctor to run research for future space missions.

The first astronauts to land on another planet might even see a similar beautiful spectacle illuminating the skies. Auroras appear when radiation from the Sun interacts with the atmosphere and almost all planets in the Solar System have auroras of some sort.

Image Credit: ESA/IPEV/PNRA–B. Healey
Explanation from: http://www.esa.int/spaceinimages/Images/2015/08/Cosmic_fire

Tycho Crater's Peak

Tycho Crater's Peak

On June 10, 2011, NASA's Lunar Reconnaissance Orbiter spacecraft angled its orbit 65° to the west, allowing the LRO Camera NACs to capture a dramatic sunrise view of Tycho crater.

A very popular target with amateur astronomers, Tycho is located at 43.37°S, 348.68°E, and is about 51 miles (82 km) in diameter. The summit of the central peak is 1.24 miles (2 km) above the crater floor. The distance from Tycho's floor to its rim is about 2.92 miles (4.7 km).

Tycho crater's central peak complex, shown here, is about 9.3 miles (15 km) wide, left to right (southeast to northwest in this view).

Image Credit: NASA Goddard/Arizona State University
Explanation from: https://www.nasa.gov/mission_pages/LRO/multimedia/tycho-peak-gal.html

Exoplanet OGLE-2016-BLG-1195Lb

Exoplanet OGLE-2016-BLG-1195Lb

Scientists have discovered a new planet with the mass of Earth, orbiting its star at the same distance that we orbit our Sun. The planet is likely far too cold to be habitable for life as we know it, however, because its star is so faint. But the discovery adds to scientists' understanding of the types of planetary systems that exist beyond our own.

"This 'iceball' planet is the lowest-mass planet ever found through microlensing," said Yossi Shvartzvald, a NASA postdoctoral fellow based at NASA's Jet Propulsion Laboratory, Pasadena, California.

Microlensing is a technique that facilitates the discovery of distant objects by using background stars as flashlights. When a star crosses precisely in front of a bright star in the background, the gravity of the foreground star focuses the light of the background star, making it appear brighter. A planet orbiting the foreground object may cause an additional blip in the star’s brightness. In this case, the blip only lasted a few hours. This technique has found the most distant known exoplanets from Earth, and can detect low-mass planets that are substantially farther from their stars than Earth is from our Sun.

The newly discovered planet, called OGLE-2016-BLG-1195Lb, aids scientists in their quest to figure out the distribution of planets in our galaxy. An open question is whether there is a difference in the frequency of planets in the Milky Way's central bulge compared to its disk, the pancake-like region surrounding the bulge. OGLE-2016-BLG-1195Lb is located in the disk, as are two planets previously detected through microlensing by NASA's Spitzer Space Telescope.

"Although we only have a handful of planetary systems with well-determined distances that are this far outside our solar system, the lack of Spitzer detections in the bulge suggests that planets may be less common toward the center of our galaxy than in the disk," said Geoff Bryden, astronomer at JPL and co-author of the study.

For the new study, researchers were alerted to the initial microlensing event by the ground-based Optical Gravitational Lensing Experiment (OGLE) survey, managed by the University of Warsaw in Poland. Study authors used the Korea Microlensing Telescope Network (KMTNet), operated by the Korea Astronomy and Space Science Institute, and Spitzer, to track the event from Earth and space.

KMTNet consists of three wide-field telescopes: one in Chile, one in Australia, and one in South Africa. When scientists from the Spitzer team received the OGLE alert, they realized the potential for a planetary discovery. The microlensing event alert was only a couple of hours before Spitzer's targets for the week were to be finalized, but it made the cut.

With both KMTNet and Spitzer observing the event, scientists had two vantage points from which to study the objects involved, as though two eyes separated by a great distance were viewing it. Having data from these two perspectives allowed them to detect the planet with KMTNet and calculate the mass of the star and the planet using Spitzer data.

"We are able to know details about this planet because of the synergy between KMTNet and Spitzer," said Andrew Gould, professor emeritus of astronomy at Ohio State University, Columbus, and study co-author.

Although OGLE-2016-BLG-1195Lb is about the same mass as Earth, and the same distance from its host star as our planet is from our Sun, the similarities may end there.

OGLE-2016-BLG-1195Lb is nearly 13,000 light-years away and orbits a star so small, scientists aren't sure if it's a star at all. It could be a brown dwarf, a star-like object whose core is not hot enough to generate energy through nuclear fusion. This particular star is only 7.8 percent the mass of our Sun, right on the border between being a star and not.

Alternatively, it could be an ultra-cool dwarf star much like TRAPPIST-1, which Spitzer and ground-based telescopes recently revealed to host seven Earth-size planets. Those seven planets all huddle closely around TRAPPIST-1, even closer than Mercury orbits our Sun, and they all have potential for liquid water. But OGLE-2016-BLG-1195Lb, at the Sun-Earth distance from a very faint star, would be extremely cold -- likely even colder than Pluto is in our own solar system, such that any surface water would be frozen. A planet would need to orbit much closer to the tiny, faint star to receive enough light to maintain liquid water on its surface.

Ground-based telescopes available today are not able to find smaller planets than this one using the microlensing method. A highly sensitive space telescope would be needed to spot smaller bodies in microlensing events. NASA's upcoming Wide Field Infrared Survey Telescope (WFIRST), planned for launch in the mid-2020s, will have this capability.

"One of the problems with estimating how many planets like this are out there is that we have reached the lower limit of planet masses that we can currently detect with microlensing," Shvartzvald said. "WFIRST will be able to change that."

Image Credit: NASA/JPL-Caltech
Explanation from: https://www.nasa.gov/feature/jpl/iceball-planet-discovered-through-microlensing

April 26, 2017

Glacier Shape Influences Susceptibility to Melting

Kangerlugssuup Sermerssua Glacier
Terminus of Kangerlugssuup Sermerssua glacier in west Greenland

A new NASA-funded study has identified which glaciers in West Greenland are most susceptible to thinning in the coming decades by analyzing how they’re shaped. The research could help predict how much the Greenland Ice Sheet will contribute to future sea level rise in the next century, a number that currently ranges from inches to feet.

“There are glaciers that popped up in our study that flew under the radar until now,” said lead author Denis Felikson, a graduate research assistant at The University of Texas Institute for Geophysics (UTIG) and a Ph.D. student in The University of Texas Department of Aerospace Engineering and Engineering Mechanics. Felikson’s study was published in Nature Geoscience on April 17.

The Greenland Ice Sheet is the second largest ice sheet on Earth and has been losing mass for decades, a trend scientists have linked to a warming climate. However, the mass change experienced by individual coastal glaciers, which flow out from the ice sheet into the ocean, is highly variable. This makes predicting the impact on future sea-level rise difficult.

“We were looking for a way to explain why this variability exists, and we found a way to do it that has never been applied before on this scale,” Felikson said.

Of the 16 glaciers researchers investigated in West Greenland, the study found four that are the most susceptible to thinning: Rink Isbrae, Umiamako Isbrae, Jakobshavn Isbrae and Sermeq Silardleq.

Umiamako Isbrae, Sermeq Silardleq and Jakobshavn Isbrae are already losing mass, with Jakobshavn being responsible for more than 81 percent of West Greenland’s total mass loss over the past 30 years.

Rink has remained stable since 1985, but through shape analysis researchers found that it could start to thin if its terminus, the front of the glacier exposed to ocean water, becomes unstable. This is a strong possibility as the climate continues to warm.

"Not long ago we didn't even know how much ice Greenland was losing, now we're getting down to the critical details that control its behavior," said Tom Wagner, director of NASA’s cryosphere program, which sponsored the research.

The analysis works by calculating how far inland thinning that starts at the terminus of each glacier is likely to extend. Glaciers with thinning that reaches far inland are the most susceptible to ice mass loss.

Just how prone a glacier is to thinning depends on its thickness and surface slope, features that are influenced by the landscape under the glacier. In general, thinning spreads more easily across thick and flat glaciers and is hindered by thin and steep portions of glaciers.

The research revealed that most glaciers are susceptible to thinning between 10 and 30 miles inland. For Jakobshavn, however, the risk of thinning reaches over 150 miles inland—almost one-third of the way across the Greenland Ice Sheet.

“Jakobshavn is particularly vulnerable to thinning because it flows through a very deep trough that extends deep into the ice sheet interior, making the ice thick and the surface flat,” Felikson said.

Felikson said these calculations will help identify which areas of Greenland may be most susceptible to melting and thus contribute most to future sea level rise. However, while the method can point out vulnerable areas, it can’t predict how much mass loss is likely to occur.

Still, knowing which glaciers are the most at risk can help scientists allocate limited resources, said co-author Timothy Bartholomaus, an assistant professor at the University of Idaho. “The approach we demonstrate here allows us to identify which outlet glaciers are not yet changing rapidly, but might,” Bartholomaus said. “With that knowledge, we can anticipate potential sea-level rise and set up the observational campaigns in advance to understand these glacier changes.”

Among other sources of data, Felikson and his team used a bedrock topography map created with data from NASA’s Ocean Melting Greenland project to determine the thickness of the ice and a digital elevation model from the Greenland Ice Mapping Project, which uses measurements from the Japanese-provided Advanced Spaceborne Thermal Emission and Reflection Radiometer (ASTER) instrument on NASA’s Terra satellite, to separate glacier catchments.

Ginny Catania, an associate professor in the University of Texas Jackson School of Geosciences and research associate at UTIG, said the group has plans to apply the shape analysis technique to other glaciers. “Our plan is to extend the analysis so that we can identify glaciers in Antarctica and around the rest of Greenland that are most likely to be susceptible to change in the future,” she said.

Study collaborators include researchers at Iceland’s Institute of Earth Sciences, the University of Copenhagen, the University of California, the University of Kansas, Oregon State University and the University of Oregon. The research was funded by NASA and The University of Texas Aerospace Engineering and Engineering Mechanics Department.

Image Credit: Denis Felikson, Univ. of Texas
Explanation from: https://www.nasa.gov/feature/goddard/2017/glacier-shape-influences-susceptibility-to-melting

Taking AIM at Night-Shining Clouds: 10 Years, 10 Science Highlights

Noctilucent Clouds
Noctilucent clouds appeared in the sky above Edmonton, Alberta, in Canada on July 2, 2011

Launched on April 25, 2007, NASA’s Aeronomy of Ice in the Mesosphere, or AIM, mission, has provided a wealth of new science on the dynamics and composition of Earth’s upper atmosphere. Designed to study noctilucent, or night-shining, clouds, AIM’s data have helped scientists understand a host of upper-atmosphere phenomena, from radio echoes to giant, planet-scale atmospheric waves.

“AIM started out studying clouds that form on the edge of space, about 50 miles above Earth, to understand why they form and how they vary,” said Jim Russell, principal investigator of the AIM mission at Hampton University in Hampton, Virginia. But he says that 10 years of data from AIM has far exceeded the initial expectations. “We’ve made great strides in answering this question and learned far more about the atmosphere than we ever imagined when the mission was conceived.”

Noctilucent clouds form in Earth’s mesosphere. They’re made of ice crystals, which reflect sunlight to give off the clouds’ signature blueish glow. Though scientists had ideas about how and why these clouds form before AIM launched, the mission’s 10 years’ worth of data have confirmed their origins.

“The accepted theory was that the ice formed around meteoric smoke — very small, nanometer-scale particles that are remnants of meteors burning up in the atmosphere,” said Diego Janches, project scientist for the AIM mission at NASA’s Goddard Space Flight Center in Greenbelt, Maryland. “With AIM, we were able to study the presence and variability of that smoke.”

Over the next few years, AIM will enter a new phase of science. Because of the way the spacecraft’s orbit has shifted over time, AIM is now in an ideal position to study gravity waves, oscillations in the air usually caused by weather and winds near Earth’s surface.

“These gravity waves affect the entire circulation of the middle and upper atmosphere,” said Cora Randall, principal investigator of AIM’s Cloud Imaging and Particle Size, or CIPS, experiment at University of Colorado Boulder. “These are really important for the global atmospheric structure and composition, and even affect the polar vortex.”

AIM’s CIPS instrument can detect tiny changes in ultraviolet light reflected off of Earth’s atmosphere about 30 miles above the surface. Those tiny changes can reveal the gravity waves coming from below, much like ripples on the surface of a pond can be traced back to a dropped pebble.

AIM’s new measurements of these gravity waves, along with observations from ground-based missions and other satellite missions, will give scientists new insight into the behavior of the uppermost atmosphere at the edge of space.

“By taking these measurements at the same time, we’ll hopefully be able to link processes in the stratosphere to changes in the thermosphere even higher up,” said Janches.

AIM’s data have led to more than 200 papers on Earth’s upper atmosphere. A handful of key scientific discoveries:

  • Overturning assumptions about the sun and noctilucent clouds: Observations from the 1980s and ’90s suggested that the appearance of noctilucent clouds is linked to the sun’s activity, which rises and falls in about 11-year patterns. But AIM’s data tell a different story: noctilucent clouds have been steadily increasing over the past decade, despite the sun’s regular changes in activity. The precise reason for this is still unknown.
  • Noctilucent cloud and greenhouse gases: Scientists suspected that increased sightings of noctilucent clouds could be related to increasing greenhouse gases. Combining AIM’s data with 36 years of measurements from satellite instruments showed a correlation between more frequent noctilucent clouds and increases in water vapor, a greenhouse gas, and decreasing upper-atmosphere temperatures — a side effect of warming near the surface.
  • Meteors help create noctilucent clouds: The ice crystals that form noctilucent clouds must form on a foundation of some kind. AIM’s data showed that this base is actually smoke from meteors — tiny microparticles produced when meteors burn up in Earth’s atmosphere.
  • Tracking meteoric smoke: Before AIM’s launch, scientists primarily watched meteoric smoke — the tiny particles created when meteors burn up in the atmosphere — from just a few viewpoints with sounding rockets. AIM’s measurements have given scientists a new tool to watch this meteoric smoke, revealing for the first time the dynamics of how meteoric smoke moves through the atmosphere.
  • Understanding the upper atmosphere: AIM helped scientists track how heat moves in the upper atmosphere, showing that heating in the mesosphere is more likely linked to circulation in the atmosphere rather than direct heating from the sun.
  • Studying atmospheric waves caused by Earth’s rotation: AIM measures planetary waves, planet-scale waves caused by Earth’s rotation, that can influence weather across the globe. Over its 10-year mission, AIM has observed three of the four most extreme springtime planetary wave events seen since satellite observations began in 1978, raising questions about possible changes in the dynamics of the atmosphere.
  • Teleconnection between the poles: AIM’s data showed that conditions in the stratosphere near the North Pole influence conditions in the mesosphere near the South Pole days or weeks later — even going so far as to influence the transition between seasonal conditions.
  • How Earth’s weather affects the upper atmosphere: AIM’s measurements have also helped scientists track how air in the atmosphere moves vertically, as well as between the hemispheres. This helps scientists understand how events near Earth’s surface — like thunderstorms — might trigger changes in the upper atmosphere.
  • Understanding the atmosphere from bottom to top: This new understanding of vertical linkages in the atmosphere was integrated into the first weather model that describes the entire atmosphere from the surface all the way to the upper mesosphere.
  • The source of radar echoes: AIM solved the mystery of radar echoes in certain regions of the atmosphere during the summer. The same ice layer that produces noctilucent clouds is to blame for radar echoes, and the size of the ice crystals can even play a role.

Image Credit: NASA/Dave Hughes
Explanation from: https://www.nasa.gov/feature/goddard/2017/taking-aim-at-night-shining-clouds-10-years-10-science-highlights

NASA's Fermi Catches Gamma-ray Flashes from Tropical Storms

Typhoon Bolaven
Typhoon Bolaven, August 2012

About a thousand times a day, thunderstorms fire off fleeting bursts of some of the highest-energy light naturally found on Earth. These events, called terrestrial gamma-ray flashes (TGFs), last less than a millisecond and produce gamma rays with tens of millions of times the energy of visible light. Since its launch in 2008, NASA's Fermi Gamma-ray Space Telescope has recorded more than 4,000 TGFs, which scientists are studying to better understand how the phenomenon relates to lightning activity, storm strength and the life cycle of storms.

Now, for the first time, a team of NASA scientists has analyzed dozens of TGFs launched by the largest and strongest weather systems on the planet: tropical storms, hurricanes and typhoons.

"One result is a confirmation that storm intensity alone is not the key factor for producing TGFs," said Oliver Roberts, who led the study at the University College Dublin, Ireland, and is now at NASA's Marshall Space Flight Center in Huntsville, Alabama. "We found a few TGFs were made in the outer rain bands of major storms, hundreds of kilometers from the powerful eye walls at their centers, and one weak system that fired off several TGFs in a day."

Scientists suspect TGFs arise from the strong electric fields near the tops of thunderstorms. Under certain conditions, these fields become strong enough to drive an "avalanche" of electrons upward at nearly the speed of light. When these accelerated electrons race past air molecules, their paths become deflected slightly. This change causes the electrons to emit gamma rays.

​Fermi's Gamma-ray Burst Monitor (GBM) detects TGFs occurring within about 500 miles (800 kilometers) of the location directly beneath the spacecraft. In 2012, GBM scientists employed new techniques that effectively upgraded the instrument, increasing its sensitivity and leading to a higher rate of TGF detections.

This enhanced discovery rate helped the GBM team show that most TGFs also generate a strong pulse of very low frequency radio waves, signals previously attributed only to lightning. Facilities like the Total Lightning Network operated by Earth Networks in Germantown, Maryland, and the World Wide Lightning Location Network, a research collaboration run by the University of Washington in Seattle, can pinpoint lightning- and TGF-produced radio pulses to within 6 miles (10 km) anywhere on the globe.

"Combining TGF data from GBM with precise positions from these lightning detection networks has opened up our ability to connect the outbursts to individual storms and their components," said co-author Michael Briggs, assistant director of the Center for Space Plasma and Aeronomic Research at University of Huntsville (UAH).

The team studied 37 TGFs associated with, among other storms, typhoons Nangka (2015) and Bolaven (2012), Hurricane Paula (2010), the 2013 tropical storms Sonia and Emang and Hurricane Manuel, and the disturbance that would later become Hurricane Julio in 2014.

"In our study, Julio holds the record for TGFs, firing off four within 100 minutes on Aug. 3, 2014, another the day after, and then no more for the life of the storm," Roberts said. "Most of this activity occurred as Julio underwent rapid intensification into a tropical depression, but long before it had even become a named storm."

What the scientists have learned so far is that TGFs from tropical systems do not have properties measurably different from other TGFs detected by Fermi. Weaker storms are capable of producing greater numbers of TGFs, which may arise anywhere in the storm. In more developed systems, like hurricanes and typhoons, TGFs are more common in the outermost rain bands, areas that also host the highest lightning rates in these storms.

Most of the tropical storm TGFs occurred as the systems intensified. Strengthening updrafts drive clouds higher into the atmosphere where they can generate powerful electric fields, setting the stage for intense lightning and for the electron avalanches thought to produce TGFs.

TGFs were discovered in 1992 by NASA's Compton Gamma-Ray Observatory, which operated until 2000.

The Fermi Gamma-ray Space Telescope is an astrophysics and particle physics partnership managed by NASA's Goddard Space Flight Center in Greenbelt, Maryland. Fermi was developed in collaboration with the U.S. Department of Energy, with important contributions from academic institutions and partners in France, Germany, Italy, Japan, Sweden and the United States.

Image Credit: Jeff Schmaltz, LANCE MODIS Rapid Response Team at NASA GSFC
Explanation from: https://www.nasa.gov/feature/goddard/2017/nasas-fermi-catches-gamma-ray-flashes-from-tropical-storms

Planetary Nebula NGC 6326

Planetary Nebula NGC 6326

The Hubble Space Telescope captured this beautiful image of NGC 6326, a planetary nebula with glowing wisps of outpouring gas that are lit up by a central star nearing the end of its life. When a star ages and the red giant phase of its life comes to an end, it starts to eject layers of gas from its surface leaving behind a hot and compact white dwarf. Sometimes this ejection results in elegantly symmetric patterns of glowing gas, but NGC 6326 is much less structured. This object is located in the constellation of Ara, the Altar, about 11 000 light-years from Earth.

Planetary nebulae are one of the main ways in which elements heavier than hydrogen and helium are dispersed into space after their creation in the hearts of stars. Eventually some of this outflung material may form new stars and planets. The vivid red and blue hues in this image come from the material glowing under the action of the fierce ultraviolet radiation from the still hot central star.

This picture was created from images taken using the Hubble Space Telescope’s Wide Field Planetary Camera 2. The red light was captured through a filter letting through the glow from hydrogen gas (F658N). The blue glow comes from ionised oxygen and was recorded through a green filter (F502N). The green layer of the image, which shows the stars well, was taken through a broader yellow filter (F555W). The total exposure times were 1400 s, 360 s and 260 s respectively. The field of view is about 30 arcseconds across.

Image Credit: ESA/Hubble and NASA
Explanation from: https://www.spacetelescope.org/images/potw1010a/

Spiral Galaxy NGC 4725

Spiral Galaxy NGC 4725

On August 25, 2003, NASA's Spitzer Space Telescope blasted into the same dark skies it now better understands. In just two years, the observatory's infrared eyes have uncovered a hidden universe teeming with warm stellar embryos, chaotic planet-forming disks, and majestic galaxies, including the delightfully odd galaxy called NGC 4725 shown here.

This peculiar galaxy is thought to have only one spiral arm. Most spiral galaxies have two or more arms. Astronomers refer to NGC 4725 as a ringed barred spiral galaxy because a prominent ring of stars encircles a bar of stars at its center (the bar is seen here as a horizontal ridge with faint red features). Our own Milky Way galaxy sports multiple arms and a proportionally smaller bar and ring.

In this infrared Spitzer picture, the galaxy's arm is highlighted in red, while its center and outlying halo are blue. Red represents warm dust clouds illuminated by newborn stars, while blue indicates older, cooler stellar populations. The red spokes seen projecting outward from the arm are clumps of stellar matter that may have been pushed together by instable magnetic fields.

NGC 4725 is located 41 million light-years away in the constellation Coma Berenices.

This picture is composed of four images taken by Spitzer's infrared array camera at 3.6 (blue), 4.5 (green), 5.8 (red), and 8.0 (red) microns. The contribution from starlight (measured at 3.6 microns) has been subtracted from the 5.8- and 8-micron images to enhance the visibility of the dust features.

Image Credit: NASA/JPL-Caltech/R. Kennicutt (University of Arizona) and the SINGS Team
Explanation from: http://www.spitzer.caltech.edu/images/2355-sig05-011-NGC-4725

The Rosette Nebula

Rosette Nebula

Unicorns and roses are usually the stuff of fairy tales, but a new cosmic image taken by NASA's Wide-field Infrared Explorer (WISE) shows the Rosette nebula located within the constellation Monoceros, or the Unicorn.

This flower-shaped nebula, also known by the less romantic name NGC 2237, is a huge star-forming cloud of dust and gas in our Milky Way galaxy. Estimates of the nebula's distance vary from 4,500 to 5,000 light-years away.

At the center of the flower is a cluster of young stars called NGC 2244. The most massive stars produce huge amounts of ultraviolet radiation, and blow strong winds that erode away the nearby gas and dust, creating a large, central hole. The radiation also strips electrons from the surrounding hydrogen gas, ionizing it and creating what astronomers call an HII region.

Although the Rosette nebula is too faint to see with the naked eye, NGC 2244 is beloved by amateur astronomers because it is visible through a small telescope or good pair of binoculars. The English astronomer John Flamsteed discovered the star cluster NGC 2244 with a telescope around 1690, but the nebula itself was not identified until John Herschel (son of William Herschel, discoverer of infrared light) observed it almost 150 years later.

The streak seen at lower left is the trail of a satellite, captured as WISE snapped the multiple frames that make up this view.

This image is a four-color composite created by all four of WISE's infrared detectors. Color is representational: blue and cyan represent infrared light at wavelengths of 3.4 and 4.6 microns, which is dominated by light from stars. Green and red represent light at 12 and 22 microns, which is mostly light from warm dust.

Image Credit: NASA/JPL-Caltech/UCLA
Explanation from: https://photojournal.jpl.nasa.gov/catalog/PIA13126

April 25, 2017

Cassini Completes Final - and Fateful - Titan Flyby

Saturn's moon TitanSaturn's moon Titan

NASA's Cassini spacecraft has had its last close brush with Saturn's hazy moon Titan and is now beginning its final set of 22 orbits around the ringed planet.

The spacecraft made its 127th and final close approach to Titan on April 21 at 11:08 p.m. PDT (2:08 a.m. EDT on April 22), passing at an altitude of about 608 miles (979 kilometers) above the moon's surface.

Cassini transmitted its images and other data to Earth following the encounter. Scientists with Cassini's radar investigation will be looking this week at their final set of new radar images of the hydrocarbon seas and lakes that spread across Titan's north polar region. The planned imaging coverage includes a region previously seen by Cassini's imaging cameras, but not by radar. The radar team also plans to use the new data to probe the depths and compositions of some of Titan's small lakes for the first (and last) time, and look for further evidence of the evolving feature researchers have dubbed the "magic island."

"Cassini's up-close exploration of Titan is now behind us, but the rich volume of data the spacecraft has collected will fuel scientific study for decades to come," said Linda Spilker, the mission's project scientist at NASA's Jet Propulsion Laboratory in Pasadena, California.

Gateway to the Grand Finale

The flyby also put Cassini on course for its dramatic last act, known as the Grand Finale. As the spacecraft passed over Titan, the moon's gravity bent its path, reshaping the robotic probe's orbit slightly so that instead of passing just outside Saturn's main rings, Cassini will begin a series of 22 dives between the rings and the planet on April 26. The mission will conclude with a science-rich plunge into Saturn's atmosphere on September 15.

"With this flyby we're committed to the Grand Finale," said Earl Maize, Cassini project manager at JPL. "The spacecraft is now on a ballistic path, so that even if we were to forgo future small course adjustments using thrusters, we would still enter Saturn's atmosphere on Sept. 15 no matter what."

Cassini received a large increase in velocity of approximately 1,925 mph (precisely 860.5 meters per second) with respect to Saturn from the close encounter with Titan.

After buzzing Titan, Cassini coasted onward, reaching the farthest point in its orbital path around Saturn at 8:46 p.m. PDT (11:46 p.m. EDT) on April 22. This point, called apoapse, is where each new Cassini lap around Saturn begins. Technically, Cassini began its Grand Finale orbits at this time, but since the excitement of the finale begins in earnest on April 26 with the first ultra-close dive past Saturn, the mission is celebrating the latter milestone as the formal beginning of the finale.

The spacecraft's first finale dive will take place on April 26 at 2 a.m. PDT (5 a.m. EDT). The spacecraft will be out of contact during the dive and for about a day afterward while it makes science observations from close to the planet. The earliest time Cassini is scheduled to make radio contact with Earth is 12:05 a.m. PDT (3:05 a.m. EDT) on April 27. Images and other data are expected to begin flowing in shortly after communication is established.

Image Credit: NASA/JPL-Caltech/Space Science Institute
Explanation from: https://www.nasa.gov/feature/jpl/cassini-completes-final-and-fateful-titan-flyby

Cascading Post-coronal Loops

Cascading Post-coronal Loops

An active region that had just rotated into view blasted out a coronal mass ejection, which was immediately followed by a bright series of post-coronal loops seeking to reorganize that region's magnetic field (April 19, 2017). We have observed this phenomenon numerous times, but this one was one of the longest and clearest sequences we have seen in years. The bright loops are actually charged particles spinning along the magnetic field lines. The action was captured in a combination of two wavelengths of extreme ultraviolet light over a period of about 20 hours.

Image Credit: NASA/GSFC/Solar Dynamics Observatory
Explanation from: https://photojournal.jpl.nasa.gov/catalog/PIA21598

Martian Gullies

Martian Gullies

Gullies eroded into the steep inner slope of an impact crater at this location appear perfectly pristine in this image captured by NASA's Mars Reconnaissance Orbiter (MRO). Although at first glance it may appear that there are craters superimposed on the gully fans, inspection of HiRISE stereo coverage shows that the craters lie only on the pre-gully terrain.

Distinctive colors in the gully channels and alcoves offer another indication of youth and recent activity. The pre-gully landscape is covered by secondary craters from nearby Gasa Crater, estimated to be about 1 million years old. Although some have suggested that the Martian gullies are also about a million years old and formed in a different environment, we now know that they are continuing to form today.

Image Credit: NASA/JPL-Caltech/Univ. of Arizona
Explanation from: https://photojournal.jpl.nasa.gov/catalog/PIA21599

Red Panda

Red PandaRed PandaRed PandaRed PandaRed PandaRed PandaRed PandaRed PandaRed Panda

The red panda is a mammal native to the eastern Himalayas and southwestern China. It has reddish-brown fur, a long, shaggy tail, and a waddling gait due to its shorter front legs; it is slightly larger than a domestic cat. It is arboreal, feeds mainly on bamboo, but also eats eggs, birds, and insects. It is a solitary animal, mainly active from dusk to dawn, and is largely sedentary during the day.

The red panda has been classified as Endangered by the IUCN because its wild population is estimated at less than 10,000 mature individuals and continues to decline due to habitat loss and fragmentation, poaching, and inbreeding depression, although red pandas are protected by national laws in their range countries.

The red panda is the only living species of the genus Ailurus and the family Ailuridae. It has been previously placed in the raccoon and bear families, but the results of phylogenetic analysis provide strong support for its taxonomic classification in its own family Ailuridae, which, along with the weasel, raccoon and skunk families is part of the superfamily Musteloidea. Two subspecies are recognized. It is not closely related to the giant panda.

Explanation from: https://en.wikipedia.org/wiki/Red_panda

The Far Side of the Moon

The Far Side of the Moon

Because the Moon is tidally locked (meaning the same side always faces Earth), it was not until 1959 that the farside was first imaged by the Soviet Luna 3 spacecraft (hence the Russian names for prominent farside features, such as Mare Moscoviense). And what a surprise -­ unlike the widespread maria on the nearside, basaltic volcanism was restricted to a relatively few, smaller regions on the farside, and the battered highlands crust dominated. A different world from what we saw from Earth.

Of course, the cause of the farside/nearside asymmetry is an interesting scientific question. Past studies have shown that the crust on the farside is thicker, likely making it more difficult for magmas to erupt on the surface, limiting the amount of farside mare basalts. Why is the farside crust thicker? That is still up for debate, and in fact several presentations at this week's Lunar and Planetary Science Conference attempt to answer this question.

The Clementine mission obtained beautiful mosaics with the sun high in the sky (low phase angles), but did not have the opportunity to observe the farside at sun angles favorable for seeing surface topography. This WAC mosaic provides the most complete look at the morphology of the farside to date, and will provide a valuable resource for the scientific community. And it's simply a spectacular sight!

The Lunar Reconnaissance Orbiter Camera (LROC) Wide Angle Camera (WAC) is a push-frame camera that captures seven color bands (321, 360, 415, 566, 604, 643, and 689 nm) with a 57-km swath (105-km swath in monochrome mode) from a 50 km orbit. One of the primary objectives of LROC is to provide a global 100 m/pixel monochrome (643 nm) base map with incidence angles between 55°-70° at the equator, lighting that is favorable for morphological interpretations. Each month, the WAC provides nearly complete coverage of the Moon under unique lighting. As an added bonus, the orbit-to-orbit image overlap provides stereo coverage. Reducing all these stereo images into a global topographic map is a big job, and is being led by LROC Team Members from the German Aerospace Center (Deutsches Zentrum für Luft- und Raumfahrt; DLR). Several preliminary WAC topographic products have appeared in LROC featured images over the past year (Orientale basin, Sinus Iridum).

Image Credit: NASA/Goddard/Arizona State University.
Explanation from: https://www.nasa.gov/mission_pages/LRO/news/lro-farside.html

Airglow and the Milky Way Galaxy

Airglow and the Milky Way Galaxy

The skies above ESO’s Paranal Observatory resemble oil on water in this picture, as greens, yellows, and blues blend to create an iridescent skyscape.

The rocky, barren landscape below evokes an image of an alien world, perfectly complementing the shimmering cosmic display occurring above. The main feature is our beautiful home galaxy, the Milky Way, arching across the Chilean night sky and framing the awestruck observer on the left. The light from billions of stars combines to create the Milky Way’s glow, with huge clouds of dark dust blocking the light here and there and creating the dark and mottled pattern we observe. A natural effect known as airglow is responsible for the swathes of green and orange light that appear to be emanating from the horizon.

ESO’s Very Large Telescope can be seen as a speck in the distant background to the right atop Cerro Paranal. Its neighbour, slightly lower down, is the Visible and Infrared Survey Telescope for Astronomy (VISTA).

Image Credit: ESO/P. Horálek
Explanation from: https://www.eso.org/public/images/potw1715a/

April 24, 2017

Earth at Night: Asia and Australia

Earth at Night: Asia and Australia

Suomi NPP satellite
2016

Image Credit: NASA

Iceberg near Ferryland

Iceberg near Ferryland

Ferryland, Newfoundland and Labrador, Canada
April 16, 2017

Image Credit: Jody Martin/Reuters

Star TYC 3203-450-1 and Galaxy NGC 7250

Star TYC 3203-450-1 and Galaxy NGC 7250

In space, being outshone is an occupational hazard. This NASA/ESA Hubble Space Telescope image captures a galaxy named NGC 7250. Despite being remarkable in its own right — it has bright bursts of star formation and recorded supernova explosions — it blends into the background somewhat thanks to the gloriously bright star hogging the limelight next to it.

This bright object is a single and little-studied star named TYC 3203-450-1, located in the constellation of Lacerta (The Lizard), much closer than the much more distant galaxy. Only this way a normal star can outshine an entire galaxy, consisting of billions of stars. Astronomers studying distant objects call these stars “foreground stars” and they are often not very happy about them, as their bright light is contaminating the faint light from the more distant and interesting objects they actually want to study.

In this case TYC 3203-450-1 million times closer than NGC 7250 which lies over 45 million light-years away from us. Would the star be the same distance as NGC 7250, it would hardly be visible in this image.

Image Credit: ESA/Hubble & NASA
Explanation from: https://www.spacetelescope.org/images/potw1717a/

Detecting Life in the Ultra-dry Atacama Desert

Atacama Desert
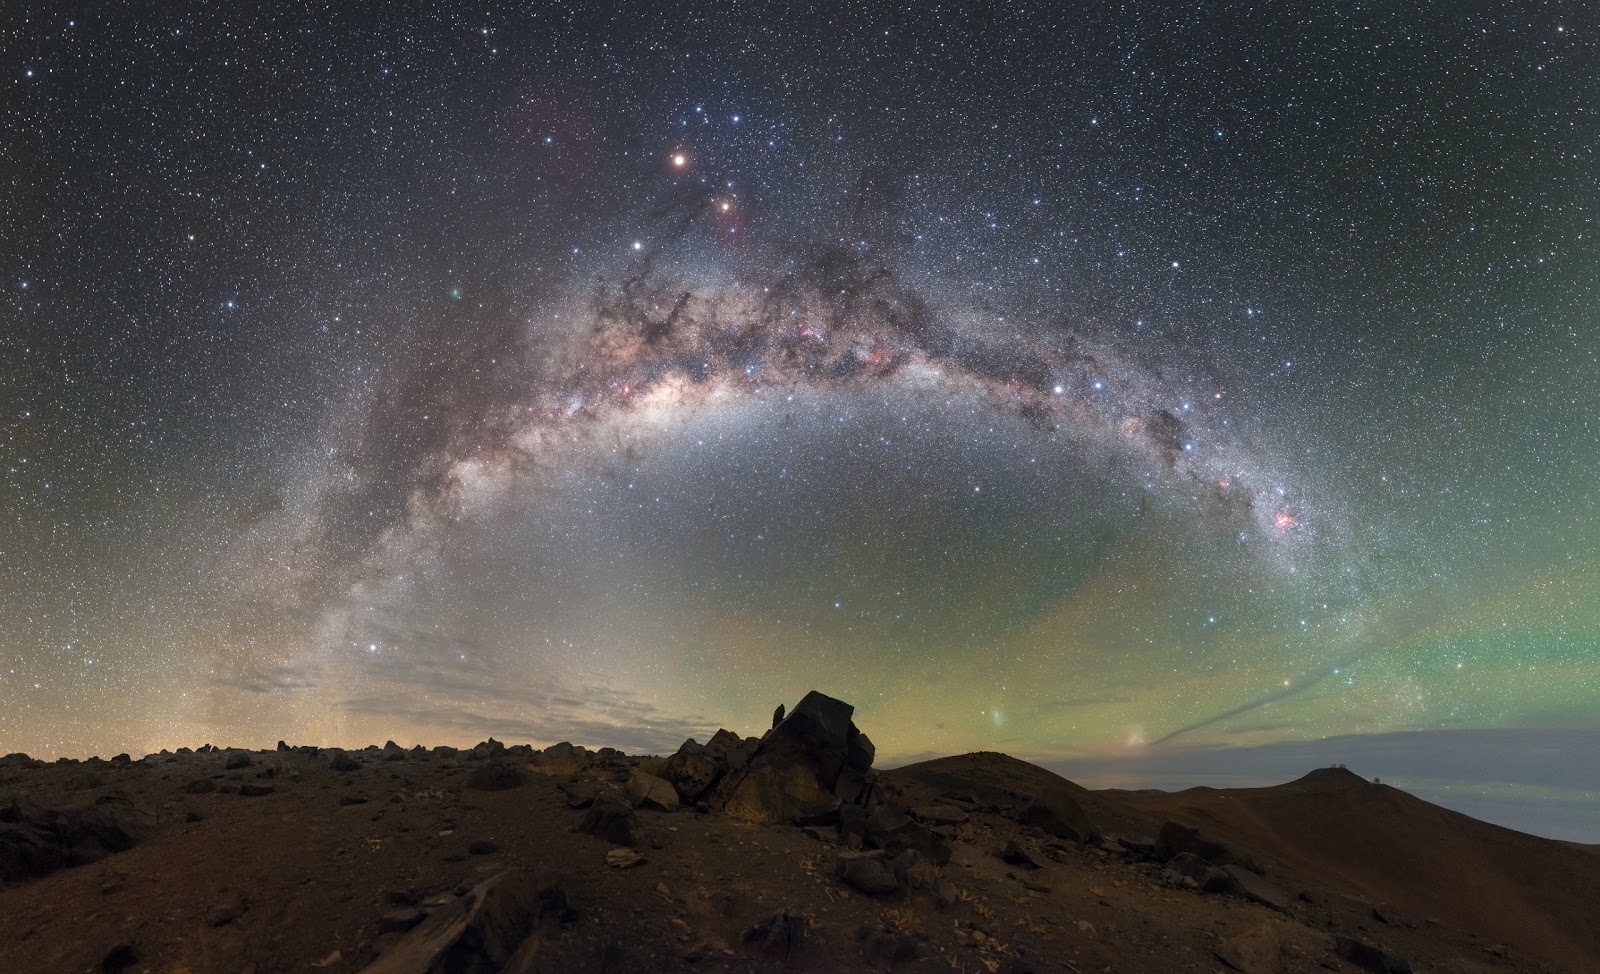
Chile's Atacama Desert is the driest non-polar desert on Earth -- and a ready analog for Mars' rugged, arid terrain.

Few places are as hostile to life as Chile's Atacama Desert. It's the driest non-polar desert on Earth, and only the hardiest microbes survive there. Its rocky landscape has lain undisturbed for eons, exposed to extreme temperatures and radiation from the sun.

If you can find life here, you might be able to find it in an even harsher environment -- like the surface of Mars. That's why a team of researchers from NASA and several universities visited the Atacama in February. They spent 10 days testing devices that could one day be used to search for signs of life on other worlds. That group included a team from NASA's Jet Propulsion Laboratory in Pasadena, California, working on a portable chemistry lab called the Chemical Laptop.

With just a small water sample, the Laptop can check for amino acids, the organic molecules that are widespread in our solar system and considered the building blocks of all life as we know it. Liquid-based analysis techniques have been shown to be orders of magnitude more sensitive than gas-based methods for the same kinds of samples. But when you scoop up a sample from Mars, the amino acids you're looking for will be trapped inside of or chemically bonded to minerals.

To break down those bonds, JPL has designed another piece of technology, a subcritical water extractor that would act as the "front end" for the Laptop. This extractor uses water to release the amino acids from a soil sample, leaving them ready to be analyzed by the Chemical Laptop.

"These two pieces of technology work together so that we can search for biosignatures in solid samples on rocky or icy worlds," said Peter Willis of JPL, the project's principal investigator. "The Atacama served as a proving ground to see how this technology would work on an arid planet like Mars."

To find life, just add water

Willis' team revisited an Atacama site he first went to in 2005. At that time, the extractor he used was manually operated; in February, the team used an automated extractor designed by Florian Kehl, a postdoctoral researcher at JPL.

The extractor ingests soil and regolith samples and mixes them with water. Then, it subjects the samples to high pressure and temperature to get the organics out.

"At high temperatures, water has the ability to dissolve the organic compounds from the soil," Kehl said. "Think of a tea bag: in cold water, not much happens. But when you add hot water, the tea releases an entire bouquet of molecules that gives the water a particular flavor, color and smell."

To remove the amino acids from those minerals, the water has to get much hotter than your ordinary cup of tea: Kehl said the extractor is currently able to reach temperatures as high as 392 degrees Fahrenheit (200 degrees Celsius).

Liquid samples would be more readily available on ocean worlds like Jupiter's moon Europa, Kehl said. There, the extractor might still be necessary, as amino acids could be bonded to minerals mixed into the ice. They also may be present as part of larger molecules, which the extractor could break into smaller building blocks before analyzing them with the Chemical Laptop. Once the extractor has prepared its samples, the Laptop can do its work.

NASA's own tricorder

The Chemical Laptop checks liquid samples for a set of 17 amino acids -- what the team refers to as "the Signature 17." By looking at the types, amounts and geometries of these amino acids in a sample, it's possible to infer the presence of life.

"All these molecules 'like' being in water," said Fernanda Mora of JPL, the Chemical Laptop's lead scientist. "They dissolve in water and they don't evaporate easily, so they're much easier to detect in water."

The Laptop mixes liquid samples with a fluorescent dye, which attaches to amino acids and makes it possible to detect them when illuminated by a laser.

Then, the sample is injected onto a separation microchip. A voltage is applied between the two ends of the channel, causing the amino acids to move at different speeds towards the end, where the laser is shining. Amino acids can be identified by how quickly they move through the channel. As the molecules pass through the laser, they emit light that is used to quantify how much of each amino acid is present.

"The idea is to automate and miniaturize all the steps you would do manually in a chemistry lab on Earth," Mora said. "That way, we can do the same analyses on another world simply by sending commands with a computer."

The near-term goal is to integrate the extractor and Chemical Laptop into a single, automated device. It would be tested during future field campaigns to the Atacama Desert with a team of researchers led by Brian Glass of NASA's Ames Research Center in Mountain View, California.

"These are some of the hardest samples to analyze you can get on the planet," Mora said of the team's work in the Atacama. She added that in the future, the team wants to test this technology in icy environments like Antarctica. Those could serve as analogs to Europa and other ocean worlds, where liquid samples would be more readily plentiful.

Image Credit: NASA/JPL-Caltech
Explanation from: https://www.nasa.gov/feature/jpl/detecting-life-in-the-driest-place-on-earth

Gravitationally Lensed Supernova

Gravitationally Lensed SupernovaGravitationally Lensed Supernova

A Swedish-led team of astronomers used the NASA/ESA Hubble Space Telescope to analyse the multiple images of a gravitationally lensed type Ia supernova for the first time. The four images of the exploding star will be used to measure the expansion of the Universe. This can be done without any theoretical assumptions about the cosmological model, giving further clues about how fast the Universe is really expanding. The results are published in the journal Science.

An international team, led by astronomers from the Stockholm University, Sweden, has discovered a distant type Ia supernova, called iPTF16geu — it took the light 4.3 billion years to travel to Earth. The light from this particular supernova was bent and magnified by the effect of gravitational lensing so that it was split into four separate images on the sky. The four images lie on a circle with a radius of only about 3000 light-years around the lensing foreground galaxy, making it one of the smallest extragalactic gravitational lenses discovered so far. Its appearance resembles the famous Refsdal supernova, which astronomers detected in 2015. Refsdal, however, was a core-collapse supernova.

Gravitationally Lensed Supernova
The galaxy SDSS J210415.89-062024.7 is located 2.5 billion light years away. It acted as a lens for a supernova at an even greater distance, creating four distinct images of the explosion — an effect created by strong gravitational lensing.

Type Ia supernovae always have the same intrinsic brightness, so by measuring how bright they appear astronomers can determine how far away they are. They are therefore known as standard candles. These supernovae have been used for decades to measure distances across the Universe, and were also used to discover its accelerated expansion and infer the existence of dark energy. Now the supernova iPTF16geu allows scientists to explore new territory, testing the theories of the warping of spacetime on smaller extragalactic scales than ever before.

“Resolving, for the first time, multiple images of a strongly lensed standard candle supernova is a major breakthrough. We can measure the light-focusing power of gravity more accurately than ever before, and probe physical scales that may have seemed out of reach until now,” says Ariel Goobar, Professor at the Oskar Klein Centre at Stockholm University and lead author of the study.

Gravitationally Lensed Supernova
The Palomar Observatory, located on Palomar Mountain, California, created this wide-field view of the night sky. In the lower central part of the image scientists discovered a supernova explosion, being lensed by a foreground galaxy.

The critical importance of the object meant that the team instigated follow-up observations of the supernova less than two months after its discovery. This involved some of the world’s leading telescopes in addition to Hubble: the Keck telescope on Mauna Kea, Hawaii, and ESO’s Very Large Telescope in Chile. Using the data gathered, the team calculated the magnification power of the lens to be a factor of 52. Because of the standard candle nature of iPTF16geu, this is the first time this measurement could be made without any prior assumptions about the form of the lens or cosmological parameters.

Currently the team is in the process of accurately measuring how long it took for the light to reach us from each of the four images of the supernova. The differences in the times of arrival can then be used to calculate the Hubble constant — the expansion rate of the Universe — with high precision. This is particularly crucial in light of the recent discrepancy between the measurements of its value in the local and the early Universe.

Gravitationally Lensed Supernova
Astronomers used the Sloan Digital Sky Survey (SDSS), carried out by a 2.5-metre wide-angle optical telescope at Apache Point Observatory in New Mexico, USA, to look for supernovae. The explosion named iPTF16geu can be seen left of the centre of the image as a tiny red dot.

As important as lensed supernovae are for cosmology, it is extremely difficult to find them. Not only does their discovery rely on a very particular and precise alignment of objects in the sky, but they are also only visible for a short time. “The discovery of iPTF16geu is truly like finding a somewhat weird needle in a haystack,” remarks Rahman Amanullah, co-author and research scientist at Stockholm University. “It reveals to us a bit more about the Universe, but mostly triggers a wealth of new scientific questions.”

Studying more similarly lensed supernovae will help shape our understanding of just how fast the Universe is expanding. The chances of finding such supernovae will improve with the installation of new survey telescopes in the near future.

Image Credit: ESA/Hubble, NASA, Sloan Digital Sky Survey, Palomar Observatory/California Institute of Technology
Explanation from: https://www.spacetelescope.org/news/heic1710/

NASA’s Cassini Mission Prepares for 'Grand Finale' at Saturn

NASA’s Cassini Mission Prepares for 'Grand Finale' at Saturn
This illustration shows NASA’s Cassini spacecraft above Saturn's northern hemisphere prior to one of its 22 grand finale dives.

NASA's Cassini spacecraft, in orbit around Saturn since 2004, is about to begin the final chapter of its remarkable story. On Wednesday, April 26, the spacecraft will make the first in a series of dives through the 1,500-mile-wide (2,400-kilometer) gap between Saturn and its rings as part of the mission’s grand finale.

"No spacecraft has ever gone through the unique region that we'll attempt to boldly cross 22 times," said Thomas Zurbuchen, associate administrator for the Science Mission Directorate at NASA Headquarters in Washington. "What we learn from Cassini’s daring final orbits will further our understanding of how giant planets, and planetary systems everywhere, form and evolve. This is truly discovery in action to the very end."

During its time at Saturn, Cassini has made numerous dramatic discoveries, including a global ocean that showed indications of hydrothermal activity within the icy moon Enceladus, and liquid methane seas on its moon Titan.

Now 20 years since launching from Earth, and after 13 years orbiting the ringed planet, Cassini is running low on fuel. In 2010, NASA decided to end the mission with a purposeful plunge into Saturn this year in order to protect and preserve the planet's moons for future exploration – especially the potentially habitable Enceladus.

But the beginning of the end for Cassini is, in many ways, like a whole new mission. Using expertise gained over the mission's many years, Cassini engineers designed a flight plan that will maximize the scientific value of sending the spacecraft toward its fateful plunge into the planet on Sept. 15. As it ticks off its terminal orbits during the next five months, the mission will rack up an impressive list of scientific achievements.

"This planned conclusion for Cassini's journey was far and away the preferred choice for the mission's scientists," said Linda Spilker, Cassini project scientist at NASA’s Jet Propulsion Laboratory (JPL) in Pasadena, California. "Cassini will make some of its most extraordinary observations at the end of its long life."

The mission team hopes to gain powerful insights into the planet's internal structure and the origins of the rings, obtain the first-ever sampling of Saturn's atmosphere and particles coming from the main rings, and capture the closest-ever views of Saturn's clouds and inner rings. The team currently is making final checks on the list of commands the robotic probe will follow to carry out its science observations, called a sequence, as it begins the finale. That sequence is scheduled to be uploaded to the spacecraft on Tuesday, April 11.

Cassini will transition to its grand finale orbits, with a last close flyby of Saturn's giant moon Titan, on Saturday, April 22. As it has many times over the course of the mission, Titan's gravity will bend Cassini's flight path. Cassini's orbit then will shrink so that instead of making its closest approach to Saturn just outside the rings, it will begin passing between the planet and the inner edge of its rings.

"Based on our best models, we expect the gap to be clear of particles large enough to damage the spacecraft. But we're also being cautious by using our large antenna as a shield on the first pass, as we determine whether it's safe to expose the science instruments to that environment on future passes," said Earl Maize, Cassini project manager at JPL. "Certainly there are some unknowns, but that's one of the reasons we're doing this kind of daring exploration at the end of the mission."

In mid-September, following a distant encounter with Titan, the spacecraft's path will be bent so that it dives into the planet. When Cassini makes its final plunge into Saturn's atmosphere on September 15, it will send data from several instruments – most notably, data on the atmosphere's composition – until its signal is lost.

"Cassini's grand finale is so much more than a final plunge," said Spilker. "It's a thrilling final chapter for our intrepid spacecraft, and so scientifically rich that it was the clear and obvious choice for how to end the mission."

Image Credit: NASA/JPL-Caltech
Explanation from: https://www.nasa.gov/press-release/nasa-s-cassini-mission-prepares-for-grand-finale-at-saturn