July 15, 2017

Grand Canyon seen from the International Space Station

Grand Canyon seen from the International Space Station

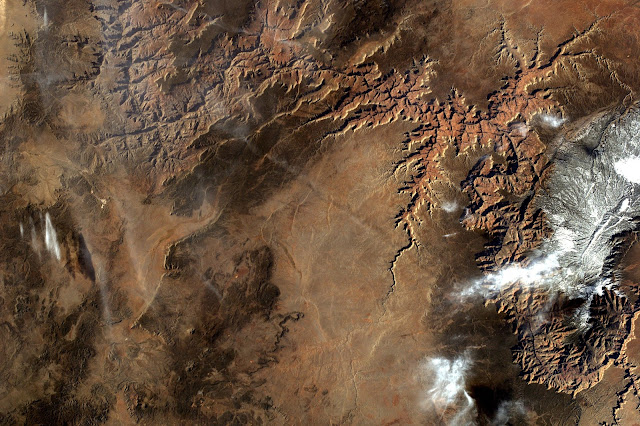
On April 3, 2017, the student-controlled EarthKAM camera aboard the International Space Station captured this photograph of a favorite target -- the Grand Canyon -- from low Earth orbit. The camera has been aboard the orbiting outpost since the first space station expedition began in November 2000 and supports approximately four missions annually.

The Sally Ride Earth Knowledge Acquired by Middle School Students (Sally Ride EarthKAM) program provides a unique educational opportunity for thousands of students multiple times a year. EarthKAM is an international award-winning education program, allowing students to photograph and analyze our planet from the perspective of the International Space Station. Using the Internet, students control a special digital camera on the orbiting laboratory to photograph Earth's coastlines, mountain ranges and other interesting geographical topography.

Image Credit: Sally Ride EarthKAM
Explanation from: https://www.nasa.gov/image-feature/space-stations-earthkam-sees-the-grand-canyon/

Elliptical Galaxy NGC 2768

Elliptical Galaxy NGC 2768

Like a lighthouse in the fog the luminous core of NGC 2768 slowly fades outwards to a dull white haze in this image taken by the NASA/ESA Hubble Space Telescope.

NGC 2768 is an elliptical galaxy in the constellation of Ursa Major (The Great Bear). It is a huge bundle of stars, dominated by a bright central region, where a supermassive black hole feasts on a constant stream of gas and dust being fed to it by its galactic host.

The galaxy is also marked by a prominent plume of dust reaching out from the centre and lying perpendicular to the galaxy’s plane. This dust conceals a symmetrical, s-shaped pair of jets that are being produced by the supermassive black hole as it feeds.

Image Credit: ESA/Hubble, NASA and S. Smartt (Queen's University Belfast)
Explanation from: https://www.spacetelescope.org/images/potw1548a/

LL Pegasi

LL Pegasi

This image is a composite of images made with the NASA/ESA Hubble Space Telescope and the Atacama Large Millimeter/submillimeter Array (ALMA), both observing the binary star system LL Pegasi. The old star LL Pegasi is continuously losing gaseous material as it evolves into a planetary nebula, and the distinct spiral shape is the imprint made by the stars orbiting in this gas.

Image Credit: ALMA (ESO/NAOJ/NRAO)/H. Kim et al., ESA/NASA & R. Sahai
Explanation from: https://www.eso.org/public/images/potw1710b/

Puyehue-Cordón Caulle Volcano Eruption

Puyehue-Cordón Caulle Volcano Eruption 

Osorno, Los Lagos, Chile
June 5, 2011

Image Credit: Ivan Alvarado

Evolution of a Supernova

Evolution of a Supernova

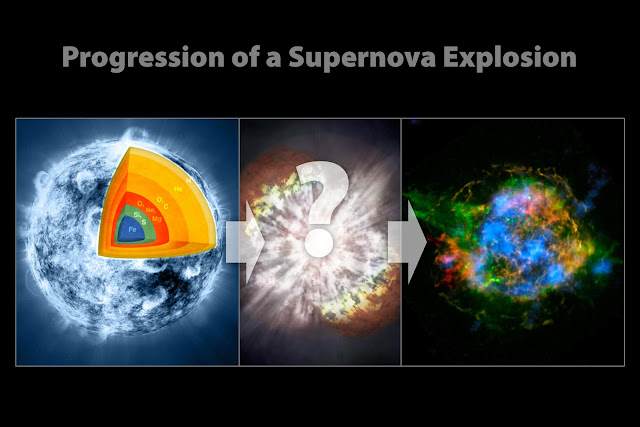
These illustrations show the progression of a supernova blast. A massive star (left), which has created elements as heavy as iron in its interior, blows up in a tremendous explosion (middle), scattering its outer layers in a structure called a supernova remnant (right). The supernova explosion itself also creates many elements, including those heavier than iron, such as gold. New observations from NASA's Nuclear Spectroscopic Telescope Array, or NuSTAR, are filling in the missing pieces in the puzzle of how massive stars explode.

Image Credit: NASA/CXC/SAO/JPL-Caltech
Explanation from: https://photojournal.jpl.nasa.gov/catalog/PIA17844

Galaxy Cluster Abell 2744

Galaxy Cluster Abell 2744

This is a NASA/ESA Hubble Space Telescope image of the galaxy cluster Abell 2744. Shown in blue on the image is a map of the dark matter found within the cluster. This cluster was part of a study of 72 galaxy cluster collisions which determined that dark matter interacts with other dark matter even less than previously thought.

Image Credit: NASA, ESA, D. Harvey

July 14, 2017

Cumulonimbus Cloud seen from the International Space Station

Cumulonimbus Cloud seen from the International Space Station

The cauliflower-like formations above the flat part of this cumulonimbus cloud represent overshooting cloud tops. Overshooting tops occur when forces push the clouds up through the troposphere, the lowest region of the atmosphere, and into the stratosphere. The warm central Pacific Ocean sea surface during the 2015-2016 El Niño lofted abnormal amounts of cloud ice and water vapor into the stratosphere, creating conditions similar to those that could occur on a larger scale in a warming world.

Image Credit: NASA/ESA
Explanation from: https://www.nasa.gov/feature/langley/2015-2016-el-ni-o-provided-natural-experiment-on-the-effects-of-warming-seas

Cassiopeia A

Cassiopeia A

The mystery of how Cassiopeia A exploded is unraveling thanks to new data from NASA's Nuclear Spectroscopic Telescope Array, or NuSTAR. In this image, NuSTAR data, which show high-energy X-rays from radioactive material, are colored blue. Lower-energy X-rays from non-radioactive material, imaged previously with NASA's Chandra X-ray Observatory, are shown in red, yellow and green.

The new view shows a more complete picture of Cassiopeia A, the remains of a star that blew up in a supernova event whose light reached Earth about 350 years ago, when it could have appeared to observers as a star that suddenly brightened. The remnant is located 11,000 light-years away from Earth.

NuSTAR is the first telescope capable of taking detailed pictures of the radioactive material in the Cassiopeia A supernova remnant. While other telescopes have detected radioactivity in these objects before, NuSTAR is the first capable of pinpointing the location of the radioactivity, creating maps. When massive star explode, they create many elements: non-radioactive ones like iron and calcium found in your blood and bones; and radioactive elements like titanium-44, the decay of which sends out high-energy X-ray light that NuSTAR can see.

By mapping titanium-44 in Cassiopeia A, astronomers get a direct look at what happened in the core of the star when it was blasted to smithereens. These NuSTAR data complement previous observations made by Chandra, which show elements, such as iron, that were heated by shock waves farther out from the remnant's center.

In this image, the red, yellow and green data were collected by Chandra at energies ranging from 1 to 7 kiloelectron volts (keV). The red color shows heated iron, and green represents heated silicon and magnesium. The yellow is what astronomers call continuum emission, and represents a range of X-ray energies.

The titanium-44, shown in blue, was detected by NuSTAR at energies ranging between 68 and 78 keV.

The NuSTAR observations point to a possible solution to the puzzle of how stars detonate. The fact that the titanium -- which is a direct tracer of the supernova blast -- is concentrated in clumps at the core supports a theory referred to as "mild asymmetries." In this scenario, material sloshes about at the heart of the supernova, reinvigorating a shock wave and allowing it to blow out the star's outer layers.

Image Credit: NASA/JPL-Caltech/CXC/SAO
Explanation from: https://photojournal.jpl.nasa.gov/catalog/PIA17838

Spiral Galaxy NGC 2500

Spiral Galaxy NGC 2500

Discovered by British astronomer William Herschel over 200 years ago, NGC 2500 lies about 30 million light-years away in the northern constellation of Lynx. As this NASA/ESA Hubble Space Telescope image shows, NGC 2500 is a particular kind of spiral galaxy known as a barred spiral, its wispy arms swirling out from a bright, elongated core.

Barred spirals are actually more common than was once thought. Around two-thirds of all spiral galaxies — including the Milky Way — exhibit these straight bars cutting through their centres. These cosmic structures act as glowing nurseries for newborn stars, and funnel material towards the active core of a galaxy. NGC 2500 is still actively forming new stars, although this process appears to be occurring very unevenly. The upper half of the galaxy — where the spiral arms are slightly better defined — hosts many more star-forming regions than the lower half, as indicated by the bright, dotted islands of light.

There is another similarity between NGC 2500 and our home galaxy. Together with Andromeda, Triangulum, and many smaller natural satellites, the Milky Way is part of the Local Group of galaxies, a gathering of over 50 galaxies all loosely held together by gravity. NGC 2500 forms a similar group with some of its nearby neighbours, including NGC 2541, NGC 2552, NGC 2537, and the bright, Andromeda-like spiral NGC 2481 (known collectively as the NGC 2841 group).

Image Credit: ESA/Hubble & NASA
Explanation from: https://www.spacetelescope.org/images/potw1728a/

July 13, 2017

Turquoise Swirls in the Black Sea

Turquoise Swirls in the Black Sea

Most summers, jewel-toned hues appear in the Black Sea. The turquoise swirls are not the brushstrokes of a painting; they indicate the presence of phytoplankton, which trace the flow of water currents and eddies.

On May 29, 2017, the Moderate Resolution Imaging Spectroradiometer (MODIS) on NASA’s Aqua satellite captured the data for this image of an ongoing phytoplankton bloom in the Black Sea. The image is a mosaic, composed from multiple satellite passes over the region.

Phytoplankton are floating, microscopic organisms that make their own food from sunlight and dissolved nutrients. Here, ample water flow from rivers like the Danube and Dnieper carries nutrients to the Black Sea. In general, phytoplankton support fish, shellfish, and other marine organisms. But large, frequent blooms can lead to eutrophication—the loss of oxygen from the water—and end up suffocating marine life.

One type of phytoplankton commonly found in the Black Sea are coccolithophores—microscopic plankton that are plated with white calcium carbonate. When aggregated in large numbers, these reflective plates are easily visible from space as bright, milky water.

“The May ramp-up in reflectivity in the Black Sea, with peak brightness in June, seems consistent with results from other years,” said Norman Kuring, an ocean scientist at NASA’s Goddard Space Flight Center. Although Kuring does not study this region, the bloom this year is one of the brightest to catch his eye since 2012.

Other types of phytoplankton can look much different in satellite imagery. “It’s important to remember that not all phytoplankton blooms make the water brighter,” Kuring said. “Diatoms, which also bloom in the Black Sea, tend to darken water more than they brighten it.”

Image Credit: Norman Kuring, NASA’s Ocean Biology Processing Group
Explanation from: https://earthobservatory.nasa.gov/IOTD/view.php?id=90318

Jupiter's Great Red Spot

Jupiter's Great Red Spot

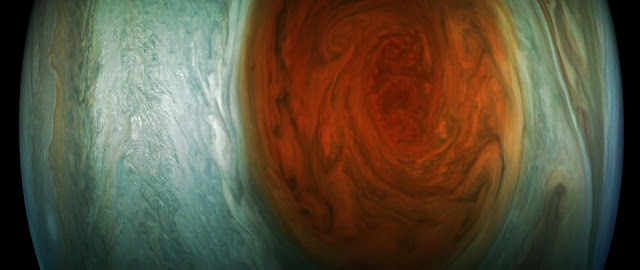
This enhanced-color image of Jupiter's Great Red Spot was created by citizen scientist Gerald Eichstädt using data from the JunoCam imager on NASA's Juno spacecraft.

The image is approximately illumination adjusted and strongly enhanced to draw viewers' eyes to the iconic storm and the turbulence around it.

The image was taken on July 10, 2017 at 07:07 p.m. PDT (10:07 p.m. EDT), as the Juno spacecraft performed its 7th close flyby of Jupiter. At the time the image was taken, the spacecraft was about 6,130 miles (9,866 kilometers) from the tops of the clouds of the planet.

Image Credit: NASA/JPL-Caltech/SwRI/MSSS/Gerald Eichstadt
Explanation from: https://photojournal.jpl.nasa.gov/catalog/PIA21773

New Lone Sunspot Group

New Lone Sunspot Group

A prominence at the edge of the Sun provided us with a splendid view of solar plasma as it churned and streamed over less than one day (June 25-26, 2017). The charged particles of plasma were being manipulated by strong magnetic forces. When viewed in this wavelength of extreme ultraviolet light, we can trace the movements of the particles. Such occurrences are fairly common but much easier to see when they are near the Sun's edge. For a sense of scale, the arch of prominence in the still image has risen up several times the size of Earth.

Image Credit: NASA/GSFC/Solar Dynamics Observatory
Explanation from: https://photojournal.jpl.nasa.gov/catalog/PIA21783

July 12, 2017

Massive Iceberg Breaks Off from Antarctica

Massive Iceberg Breaks Off from Antarctica
Snapshot of the rift in the Larsen C on November 10, 2016

An iceberg about the size of the state of Delaware split off from Antarctica’s Larsen C ice shelf sometime between July 10 and July 12. The calving of the massive new iceberg was captured by the Moderate Resolution Imaging Spectroradiometer on NASA’s Aqua satellite, and confirmed by the Visible Infrared Imaging Radiometer Suite instrument on the joint NASA/NOAA Suomi National Polar-orbiting Partnership (Suomi-NPP) satellite. The final breakage was first reported by Project Midas, an Antarctic research project based in the United Kingdom.

Larsen C, a floating platform of glacial ice on the east side of the Antarctic Peninsula, is the fourth largest ice shelf ringing Earth’s southernmost continent. In 2014, a crack that had been slowly growing into the ice shelf for decades suddenly started to spread northwards, creating the nascent iceberg. Now that the close to 2,240 square-mile (5,800 square kilometers) chunk of ice has broken away, the Larsen C shelf area has shrunk by approximately 10 percent.

“The interesting thing is what happens next, how the remaining ice shelf responds,” said Kelly Brunt, a glaciologist with NASA’s Goddard Space Flight Center in Greenbelt, Maryland, and the University of Maryland in College Park. “Will the ice shelf weaken? Or possibly collapse, like its neighbors Larsen A and B? Will the glaciers behind the ice shelf accelerate and have a direct contribution to sea level rise? Or is this just a normal calving event?”

Ice shelves fringe 75 percent of the Antarctic ice sheet. One way to assess the health of ice sheets is to look at their balance: when an ice sheet is in balance, the ice gained through snowfall equals the ice lost through melting and iceberg calving. Even relatively large calving events, where tabular ice chunks the size of Manhattan or bigger calve from the seaward front of the shelf, can be considered normal if the ice sheet is in overall balance. But sometimes ice sheets destabilize, either through the loss of a particularly big iceberg or through disintegration of an ice shelf, such as that of the Larsen A Ice Shelf in 1995 and the Larsen B Ice Shelf in 2002. When floating ice shelves disintegrate, they reduce the resistance to glacial flow and thus allow the grounded glaciers they were buttressing to significantly dump more ice into the ocean, raising sea levels.

Scientists have monitored the progression of the rift throughout the last year was using data from the European Space Agency Sentinel-1 satellites and thermal imagery from NASA’s Landsat 8 spacecraft. Over the next months and years, researchers will monitor the response of Larsen C, and the glaciers that flow into it, through the use of satellite imagery, airborne surveys, automated geophysical instruments and associated field work.

In the case of this rift, scientists were worried about the possible loss of a pinning point that helped keep Larsen C stable. In a shallow part of the sea floor underneath the ice shelf, a bedrock protrusion, named the Bawden Ice Rise, has served as an anchor point for the floating shelf for many decades. Ultimately, the rift stopped short of separating from the protrusion.

“The remaining 90 percent of the ice shelf continues to be held in place by two pinning points: the Bawden Ice Rise to the north of the rift and the Gipps Ice Rise to the south,” said Chris Shuman, a glaciologist with Goddard and the University of Maryland at Baltimore County. “So I just don’ see any near-term signs that this calving event is going to lead to the collapse of the Larsen C ice shelf. But we will be watching closely for signs of further changes across the area.”

The first available images of Larsen C are airborne photographs from the 1960s and an image from a US satellite captured in 1963. The rift that has produced the new iceberg was already identifiable in those pictures, along with a dozen other fractures. The crack remained dormant for decades, stuck in a section of the ice shelf called a suture zone, an area where glaciers flowing into the ice shelf come together. Suture zones are complex and more heterogeneous than the rest of the ice shelf, containing ice with different properties and mechanical strengths, and therefore play an important role in controlling the rate at which rifts grow. In 2014, however, this particular crack started to rapidly grow and traverse the suture zones, leaving scientists perplexed.

“We don’t currently know what changed in 2014 that allowed this rift to push through the suture zone and propagate into the main body of the ice shelf,” said Dan McGrath, a glaciologist at Colorado State University who has been studying the Larsen C ice shelf since 2008.

McGrath said the growth of the crack, given our current understanding, is not directly linked to climate change.

“The Antarctic Peninsula has been one of the fastest warming places on the planet throughout the latter half of the 20th century. This warming has driven really profound environmental changes, including the collapse of Larsen A and B,” McGrath said. “But with the rift on Larsen C, we haven’t made a direct connection with the warming climate. Still, there are definitely mechanisms by which this rift could be linked to climate change, most notably through warmer ocean waters eating away at the base of the shelf.”

While the crack was growing, scientists had a hard time predicting when the nascent iceberg would break away. It’s difficult because there are not enough measurements available on either the forces acting on the rift or the composition of the ice shelf. Further, other poorly observed external factors, such as temperatures, winds, waves and ocean currents, might play an important role in rift growth. Still, this event has provided an important opportunity for researchers to study how ice shelves fracture, with important implications for other ice shelves.

The U.S. National Ice Center will monitor the trajectory of the new iceberg, which is likely to be named A-68. The currents around Antarctica generally dictate the path that the icebergs follow. In this case, the new berg is likely to follow a similar path to the icebergs produced by the collapse of Larsen B: north along the coast of the Peninsula, then northeast into the South Atlantic.

“It’s very unlikely it will cause any trouble for navigation,” Brunt said.

Image Credit: NASA/John Sonntag
Explanation from: https://www.nasa.gov/feature/goddard/2017/massive-iceberg-breaks-off-from-antarctica
NASA's SDO Watches a Sunspot Turn Toward Earth

NASA's SDO Watches a Sunspot Turn Toward Earth

An active region on the Sun — an area of intense and complex magnetic fields — has rotated into view on the Sun and seems to be growing rather quickly in this video captured by NASA’s Solar Dynamics Observatory between July 5-11, 2017. Such sunspots are a common occurrence on the Sun, but are less frequent as we head toward solar minimum, which is the period of low solar activity during its regular approximately 11-year cycle. This sunspot is the first to appear after the Sun was spotless for two days, and it is the only sunspot group at this moment. Like freckles on the face of the Sun, they appear to be small features, but size is relative: The dark core of this sunspot is actually larger than Earth.

Image Credit: NASA’s Goddard Space Flight Center/SDO/Joy Ng, producer
Explanation from: https://www.nasa.gov/feature/goddard/2017/nasas-sdo-watches-a-sunspot-turn-toward-earth

Molecular Cloud W51

Molecular Cloud W51

  • Giant molecular clouds, containing mostly hydrogen and helium, are where most new stars and planets form.
  • W51 is one of the closest such objects to Earth so it is an excellent target for learning more about the star-formation process.
  • A new composite image of W51 with X-ray data from Chandra (blue) and Spitzer (orange and yellow-green) is being released.
  • The X-ray data show the young stars are often clumped together in clusters, while bathing their surroundings in high-energy light.

In the context of space, the term 'cloud' can mean something rather different from the fluffy white collections of water in the sky or a way to store data or process information. Giant molecular clouds are vast cosmic objects, composed primarily of hydrogen molecules and helium atoms, where new stars and planets are born. These clouds can contain more mass than a million suns, and stretch across hundreds of light years.

The giant molecular cloud known as W51 is one of the closest to Earth at a distance of about 17,000 light years. Because of its relative proximity, W51 provides astronomers with an excellent opportunity to study how stars are forming in our Milky Way galaxy.

A new composite image of W51 shows the high-energy output from this stellar nursery, where X-rays from Chandra are colored blue. In about 20 hours of Chandra exposure time, over 600 young stars were detected as point-like X-ray sources, and diffuse X-ray emission from interstellar gas with a temperature of a million degrees or more was also observed. Infrared light observed with NASA's Spitzer Space Telescope appears orange and yellow-green and shows cool gas and stars surrounded by disks of cool material.

W51 contains multiple clusters of young stars. The Chandra data show that the X-ray sources in the field are found in small clumps, with a clear concentration of more than 100 sources in the central cluster, called G49.5−0.4 (pan over the image to find this source.)

Although the W51 giant molecular cloud fills the entire field-of-view of this image, there are large areas where Chandra does not detect any diffuse, low energy X-rays from hot interstellar gas. Presumably dense regions of cooler material have displaced this hot gas or blocked X-rays from it.

One of the massive stars in W51 is a bright X-ray source that is surrounded by a concentration of much fainter X-ray sources, as shown in a close-up view of the Chandra image. This suggests that massive stars can form nearly in isolation, with just a few lower mass stars rather than the full set of hundreds that are expected in typical star clusters.

Another young, massive cluster located near the center of W51 hosts a star system that produces an extraordinarily large fraction of the highest energy X-rays detected by Chandra from W51. Theories for X-ray emission from massive single stars can't explain this mystery, so it likely requires the close interaction of two very young, massive stars. Such intense, energetic radiation must change the chemistry of the molecules surrounding the star system, presenting a hostile environment for planet formation.

Image Credit: X-ray: NASA/CXC/PSU/L.Townsley et al; Infrared: NASA/JPL-Caltech
Explanation from: http://chandra.harvard.edu/photo/2017/w51/

July 11, 2017

Earth and Dragon Spacecraft seen from the International Space Station

Earth and Dragon Spacecraft seen from the International Space Station

NASA astronaut Jack Fischer photographed the SpaceX Dragon capsule as it reentered Earth's atmosphere before splashing down in the Pacific Ocean west of Baja California at 8:12 a.m. EDT, July 3, 2017. Fischer commented, "Beautiful expanse of stars-but the “long” orange one is SpaceX-11 reentering! Congrats team for a successful splashdown & great mission!"

A variety of technological and biological studies conducted on the International Space Station are returning in Dragon. The Fruit Fly Lab-02 experiment seeks to better understand the effects of prolonged exposure to microgravity on the heart. Samples from the Systemic Therapy of NELL-1 for osteoporosis will return as part of an investigation using rodents as models to test a new drug that can both rebuild bone and block further bone loss, improving crew health. The Cardiac Stem Cells experiment investigated how microgravity affects stem cells and the factors that govern stem cell activity.

The Dragon spacecraft launched June 3 on a SpaceX Falcon 9 rocket from historic Launch Complex 39A at NASA’s Kennedy Space Center in Florida, and arrived at the station June 5.

Image Credit: NASA
Explanation from: https://www.nasa.gov/image-feature/dragon-returns-space-station-science-to-earth

Jupiter's Great Red Spot and Earth

Jupiter's Great Red Spot and Earth

Measuring in at 10,159 miles (16,350 kilometers) in width (as of April 3, 2017) Jupiter's Great Red Spot is 1.3 times as wide as Earth. This composite image was generated by combining NASA imagery of Earth with an image of Jupiter taken by astronomer Christopher Go.

Image Credit: NASA/JPL-Caltech/SwRI/MSSS/Christopher Go

Spiral Galaxy IC 342

Spiral Galaxy IC 342

IC 342 is a challenging cosmic target. Although it is bright, the galaxy sits near the equator of the Milky Way’s galactic disc, where the sky is thick with glowing cosmic gas, bright stars, and dark, obscuring dust. In order for astronomers to see the intricate spiral structure of IC 342, they must gaze through a large amount of material contained within our own galaxy — no mean feat! As a result IC 342 is relatively difficult to spot and image, giving rise to its intriguing nickname: the “Hidden Galaxy”.

Located very close (in astronomical terms!) to the Milky Way, this sweeping spiral galaxy would be among the brightest in the sky were it not for its dust-obscured location. The galaxy is very active, as indicated by the range of colours visible in this NASA/ESA Hubble Space Telescope image, depicting the very central region of the galaxy. A beautiful mixture of hot, blue star-forming regions, redder, cooler regions of gas, and dark lanes of opaque dust can be seen, all swirling together around a bright core. In 2003, astronomers confirmed this core to be a specific type of central region known as an HII nucleus — a name that indicates the presence of ionised hydrogen — that is likely to be creating many hot new stars.

Image Credit: ESA/Hubble & NASA
Explanation from: https://www.spacetelescope.org/images/potw1727a/

July 10, 2017

Saturn

Saturn

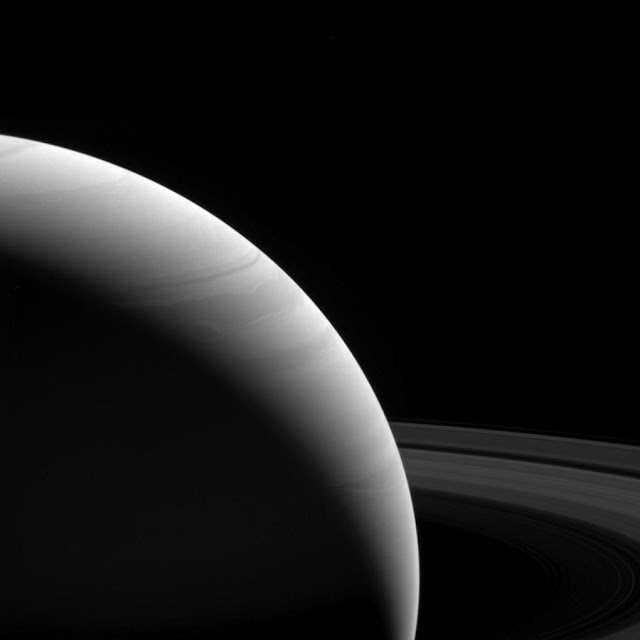
The light of a new day on Saturn illuminates the planet's wavy cloud patterns and the smooth arcs of the vast rings.

The light has traveled around 80 minutes since it left the sun's surface by the time it reaches Saturn. The illumination it provides is feeble; Earth gets 100 times the intensity since it's roughly ten times closer to the sun. Yet compared to the deep blackness of space, everything at Saturn still shines bright in the sunlight, be it direct or reflected.

This view looks toward the sunlit side of the rings from about 10 degrees above the ring plane. The image was taken with the Cassini spacecraft wide-angle camera on Feb. 25, 2017 using a spectral filter which preferentially admits wavelengths of near-infrared light centered at 939 nanometers.

The view was obtained at a distance of approximately 762,000 miles (1.23 million kilometers) from Saturn. Image scale is 45 miles (73 kilometers) per pixel.

Image Credit: NASA/JPL-Caltech/Space Science Institute
Explanation from: https://photojournal.jpl.nasa.gov/catalog/PIA21336

Artist's illustration of unlensed source galaxy

Artist's illustration of unlensed source galaxy

This artist’s illustration portrays what the gravitationally lensed galaxy SDSS J1110+6459 might look like up close. A sea of young, blue stars is streaked with dark dust lanes and studded with bright pink patches that mark sites of ongoing star formation. The patches’ signature glow comes from ionized hydrogen, like we see in the Orion Nebula in our own galaxy.

According to new research, these distant star-formation regions are clumpy and span about 200 to 300 light-years. This contradicts earlier theories suggesting that such regions might be much larger, 3000 light-years or more in size.

Image Credit: NASA, ESA, and Z. Levay (STScI)
Explanation from: https://www.spacetelescope.org/images/opo1727c/

Galaxy Cluster SDSS J1110+6459

Galaxy Cluster SDSS J1110+6459

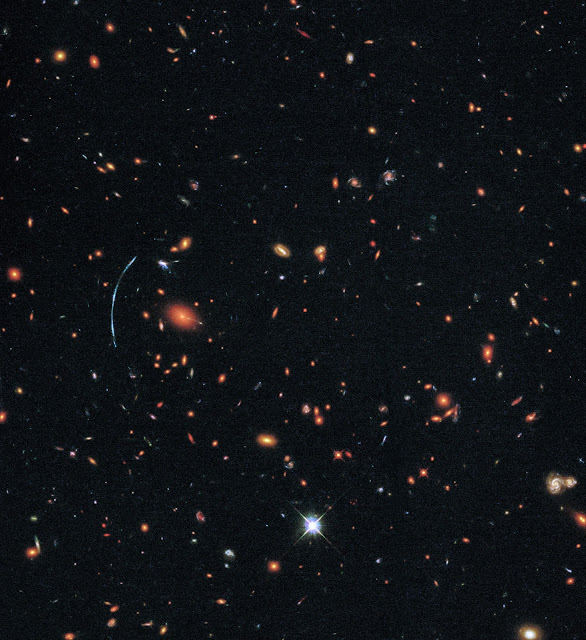
The galaxy cluster shown here, SDSS J1110+6459, was discovered as part of the Sloan Giant Arcs Survey. It is located about 6 billion light-years from Earth (redshift of z=0.659) and contains hundreds of galaxies. At left, a distinctive blue arc is actually composed of three separate images of a more distant background galaxy called SGAS J111020.0+645950.8. This background galaxy has been magnified, distorted, and multiply imaged by the gravity of the galaxy cluster in a process known as gravitational lensing.

Image Credit: NASA, ESA, and T. Johnson (University of Michigan)
Explanation from: https://www.spacetelescope.org/images/opo1727b/

July 9, 2017

Spiral Galaxy Messier 77

Spiral Galaxy Messier 77

ESO’s Very Large Telescope (VLT) has captured a magnificent face-on view of the barred spiral galaxy Messier 77. The image does justice to the galaxy’s beauty, showcasing its glittering arms criss-crossed with dust lanes — but it fails to betray Messier 77’s turbulent nature.

This picturesque spiral galaxy appears to be tranquil, but there is more to it than meets the eye. Messier 77 (also known as NGC 1068) is one of the closest active galaxies, which are some of the most energetic and spectacular objects in the Universe. Their nuclei are often bright enough to outshine the whole of the rest of the galaxy. Active galaxies are among the brightest objects in the Universe and emit light at most, if not all, wavelengths, from gamma rays and X-rays all the way to microwaves and radiowaves. Messier 77 is further classified as a Type II Seyfert galaxy, characterised by being particularly bright at infrared wavelengths.

This impressive luminosity is caused by intense radiation blasting out from a central engine — the accretion disc surrounding a supermassive black hole. Material that falls towards the black hole is compressed and heated up to incredible temperatures, causing it to radiate a tremendous amount of energy. This accretion disc is thought to be enshrouded by thick doughnut-shaped structure of gas and dust, called a “torus”. Observations of Messier 77 back in 2003 were the first to resolve such a structure using the powerful VLT Interferometer.

This image of Messier 77 was taken in four different wavelength bands represented by blue, red, violet and pink (hydrogen-alpha) colours. Each wavelength brings out a different quality: for example, the pinkish hydrogen-alpha highlights the hotter and younger stars forming in the spiral arms, while in red are the fine, thread-like filamentary structures in the gas surrounding Messier 77. A foreground Milky Way star is also seen beside the galaxy centre, displaying tell-tale diffraction spikes. Additionally, many more distant galaxies are visible; sitting at the outskirts of the spiral arms, they appear tiny and delicate compared to the colossal active galaxy .

Located 47 million light-years away in the constellation of Cetus (The Sea Monster), Messier 77 is one of the most remote galaxies of the Messier catalogue. Initially, Messier believed that the highly luminous object he saw through his telescope was a cluster of stars, but as technology progressed its true status as a galaxy was realised. At approximately 100 000 light-years across, Messier 77 is also one of largest galaxies in the Messier catalogue — so massive that its gravity causes other nearby galaxies to twist and become warped.

This image was obtained using the FOcal Reducer and low dispersion Spectrograph 2 (FORS2) instrument mounted on Unit Telescope 1 (Antu) of the VLT, located at ESO’s Paranal Observatory in Chile. It hails from ESO’s Cosmic Gems programme, an outreach initiative that produces images of interesting, intriguing or visually attractive objects using ESO telescopes for the purposes of education and outreach.

Image Credit: ESO
Explanation from: https://www.eso.org/public/news/eso1720/

Hakumyi Crater, Ceres

Hakumyi Crater, Ceres

NASA's Dawn spacecraft took this image of Hakumyi Crater on Ceres, visible left of center. The crater is named after a Paraguayan, Brazilian and Bolivian spirit said to be helpful in gardening.

Hakumyi, 18 miles (29 kilometers) in diameter, is located about 43 miles (70 kilometers) west of Ernutet Crater. Ernutet is where scientists found evidence of organic material, thanks to Dawn's visible and infrared mapping spectrometer.

Evidence for organics was also found at the 4-mile (6.5 kilometer) wide fresh crater on the southern rim of Hakumyi and on the lobe-shaped flow of material that runs into Hakumyi. These two features look relatively young in comparison to the rest of Hakumyi Crater, whose rims and overall shape are subdued. The lobate flow is reminiscent of the Type I flows identified in multiple places at high latitudes on Ceres, and suggests a significant amount of ice near the surface.

Dawn took this image on August 20, 2015, from 915 miles (1,470 kilometers) altitude. The center coordinates of this image are 48.9 degrees north latitude and 27.0 degrees east longitude.

Image Credit: NASA
Explanation from: https://photojournal.jpl.nasa.gov/catalog/PIA21413

Streaming Prominence

Streaming Prominence

A prominence at the edge of the Sun provided us with a splendid view of solar plasma as it churned and streamed over less than one day (June 25-26, 2017). The charged particles of plasma were being manipulated by strong magnetic forces. When viewed in this wavelength of extreme ultraviolet light, we can trace the movements of the particles. Such occurrences are fairly common but much easier to see when they are near the Sun's edge. For a sense of scale, the arch of prominence in the still image has risen up several times the size of Earth.

Image Credit: NASA/GSFC/Solar Dynamics Observatory
Explanation from: https://photojournal.jpl.nasa.gov/catalog/PIA21768